Line 2 has stopped three times this quarter for the same bearing. Each time, both records were correct. Each time, nobody connected them.
You do not have a bearing problem. You have a record problem.

Your line loses more hours than anyone writes down. This guide shows you how to price them, count them honestly, fix the three that cost you most, and pick a system that keeps them fixed.
October 2026
51 pages
A field guide to the hours your line loses, and how you win them back.
Copyright 2026 Fabrico. All rights reserved. You may quote short parts in articles and reviews. For anything more, ask us first in writing.
This guide does not replace an engineer who knows your plant. Your results will depend on your lines, your people and what you do next. If you read it and change nothing, your lines will keep losing what they lose today.
You will meet three kinds of number. Published figures name their source on the same page. Worked examples use round numbers so you can follow the sums, and each one says it is an example. Your numbers go in the sheets.
How to read the screensThe screens are real Fabrico screens from a demonstration plant, with sample data. They show the method, not a customer.
One line, one week, a pencil, and one hour each with your production, maintenance and quality leads. Nothing to buy.
Contact: team@fabrico.io · fabrico.io
Chapters 1 to 5: what your stops cost, and a baseline you trust.
Chapters 6 to 9: three losses, one meeting, one record, faster changeovers.
Chapters 10 and 11: a 90-day plan, a case finance signs, the right system.
Read page 4, then chapter 1. By the end of it you will know what one stopped hour costs on your line. That number decides how much of the rest you need.
Your OEE number is what is left after three kinds of loss. Here is one example shift, in minutes: where its 480 planned minutes went. In chapter 4 you measure the same four parts on your own line.
Example values: 480 planned minutes, 60 minutes of stops, 380 parts made at 1.0 minute a part, 361 of them good. Chapter 4 works through it.
| Chapter | What you will have at the end |
|---|---|
| 1 What a stopped hour costs | The cost of one hour on your line, in euros, in 20 minutes |
| 2 Where plants really stand | A first target in hours, not in OEE points |
| 3 Measuring honestly | Six losses, and a check for the five ways a number gets inflated |
| 4 A baseline on one line | A week of data nobody in your plant will argue with |
| 5 The stops paper never sees | Proof of your short stops and slow running, with a pencil |
| 6 The top three losses | Three losses, three owners, three first actions |
| 7 The ten-minute meeting | A daily meeting that decides instead of argues |
| 8 Stop reason to work card | One record for the stop and the repair |
| 9 Changeovers | The first ten minutes out, without buying anything |
| 10 The 90-day plan and the case | A plan your plant can run and a case finance can sign |
| 11 Choosing a system | Twelve questions and ten things to see live |
Your line stops at 10:40. A technician walks over, finds a jammed sensor and cleans it. By 11:10 you are running again. The maintenance log gets one line: thirty minutes, one sensor cleaned, no parts. On paper, it was a cheap stop.
It was not. For thirty minutes your line made nothing you could sell. Six of your operators waited. The first parts after the restart went into the scrap bin. Thursday's shipment was already tight, so someone booked a Saturday shift. None of that is in the maintenance log.
In this chapter you put a number on one stopped hour on your own line. It takes you about twenty minutes and one sheet of paper.
A stop causes seven kinds of cost. Your maintenance log sees two of them.
| Cost | What it is | Where it lands |
|---|---|---|
| Spare parts | Parts used in the fix | Maintenance budget |
| Repair labour | Hours to find and fix the fault | Maintenance budget |
| Lost margin | Output you did not make, at margin | Nowhere: the sale never happened |
| Idle labour | Operators paid to wait | Payroll, as normal hours |
| Scrap and restart | Bad parts after the restart | Quality and materials |
| Overtime and freight | Extra shifts, express trucks | Payroll and freight |
| Missed deliveries | Penalties, orders at risk | Sales |
You see the first two because they have their own budget line. The other five are spread over payroll, quality, freight and sales. Each looks small where it lands. Nobody sees the sum.
You do not need to guess. Someone in your plant already has each number. Ask the right person and write it down.
| Term | How you find it | Who has your number |
|---|---|---|
| Lost margin | Units an hour × margin a unit (price minus variable cost) | Controller |
| Idle labour | Operators left waiting × loaded cost an hour | Payroll |
| Scrap and restart | 12 months of restart scrap ÷ lost hours | Quality lead |
| Overtime and freight | 12 months of overtime and express freight ÷ lost hours | Planner, logistics |
| Penalties | 12 months of late penalties ÷ lost hours | Sales |
Add the five and you have the cost of one hour on that line. Leave repair labour and parts out: they are already in your maintenance budget, and you would count them twice.
Here is one line over twelve months. It lost 150 hours to 180 unplanned stops.
| Term | Inputs | € an hour |
|---|---|---|
| Lost margin | 600 units an hour × €4.00 margin | 2,400 |
| Idle labour | 6 operators × €30 loaded cost | 180 |
| Scrap and restart | 180 restarts × €150 = €27,000 ÷ 150 hours | 180 |
| Overtime and freight | 10 express shipments × €1,800 = €18,000 ÷ 150 hours | 120 |
| Penalties | None in these 12 months | 0 |
| Cost of one hour | 2,880 |
One stopped hour on this line costs €2,880. The year costs €2,880 × 150 = €432,000. Your log sees only the part below: the part you do not see is eighteen times bigger.
Example values, not typical ones. Log: repair labour and parts, €24,000 ÷ 150 hours = €160 an hour. Use your own numbers.
Breakdowns are the stops you remember. They are only one of three ways your line loses hours:
Take one 480-minute shift. A 40-minute breakdown goes into the log. Sixteen short stops of two minutes each, 32 minutes in total, do not: each is cleared in seconds, so they just look like slow running. Price the slow and scrap hours like downtime. They cost you the same margin.
Example values.
A fifth trap is the most common: lost hours from memory. You remember the long breakdowns and forget the short stops. Use your stop log, and say so.
| Line | € an hour | Lost hours a year | € a year |
|---|---|---|---|
| Line A | 2,880 | 150 | 432,000 |
| Line B | 900 | 400 | 360,000 |
| Line C | 5,000 | 60 | 300,000 |
| Line D | 600 | 250 | 150,000 |
Line C has the dearest hour. Line B loses the most hours. Line A leads on neither, and it ranks first. That is where you start.
Example rows.
Your finance team does not need your worksheets. It needs one page: every line with its lost hours, its cost an hour and its cost a year, your three biggest losses in hours, and one ask. Keep it honest: the same twelve months and the same source of lost hours for every line, every figure with the name of the person who gave it, and one ask in one sentence: fund this, for this amount, to attack this loss, which costs this much a year.
| Term | Your inputs | € an hour |
|---|---|---|
| Lost margin | units an hour × margin a unit | |
| Idle labour | operators × loaded cost an hour | |
| Scrap and restart | 12 months ÷ lost hours | |
| Overtime and freight | 12 months ÷ lost hours | |
| Penalties | 12 months ÷ lost hours | |
| Cost of one hour | sum of the five | |
| Cost a year | cost of one hour × lost hours |
Margin is price minus variable cost. Repair labour and parts stay out. Lost hours come from your stop log or your machines.
 The same, run from the machines
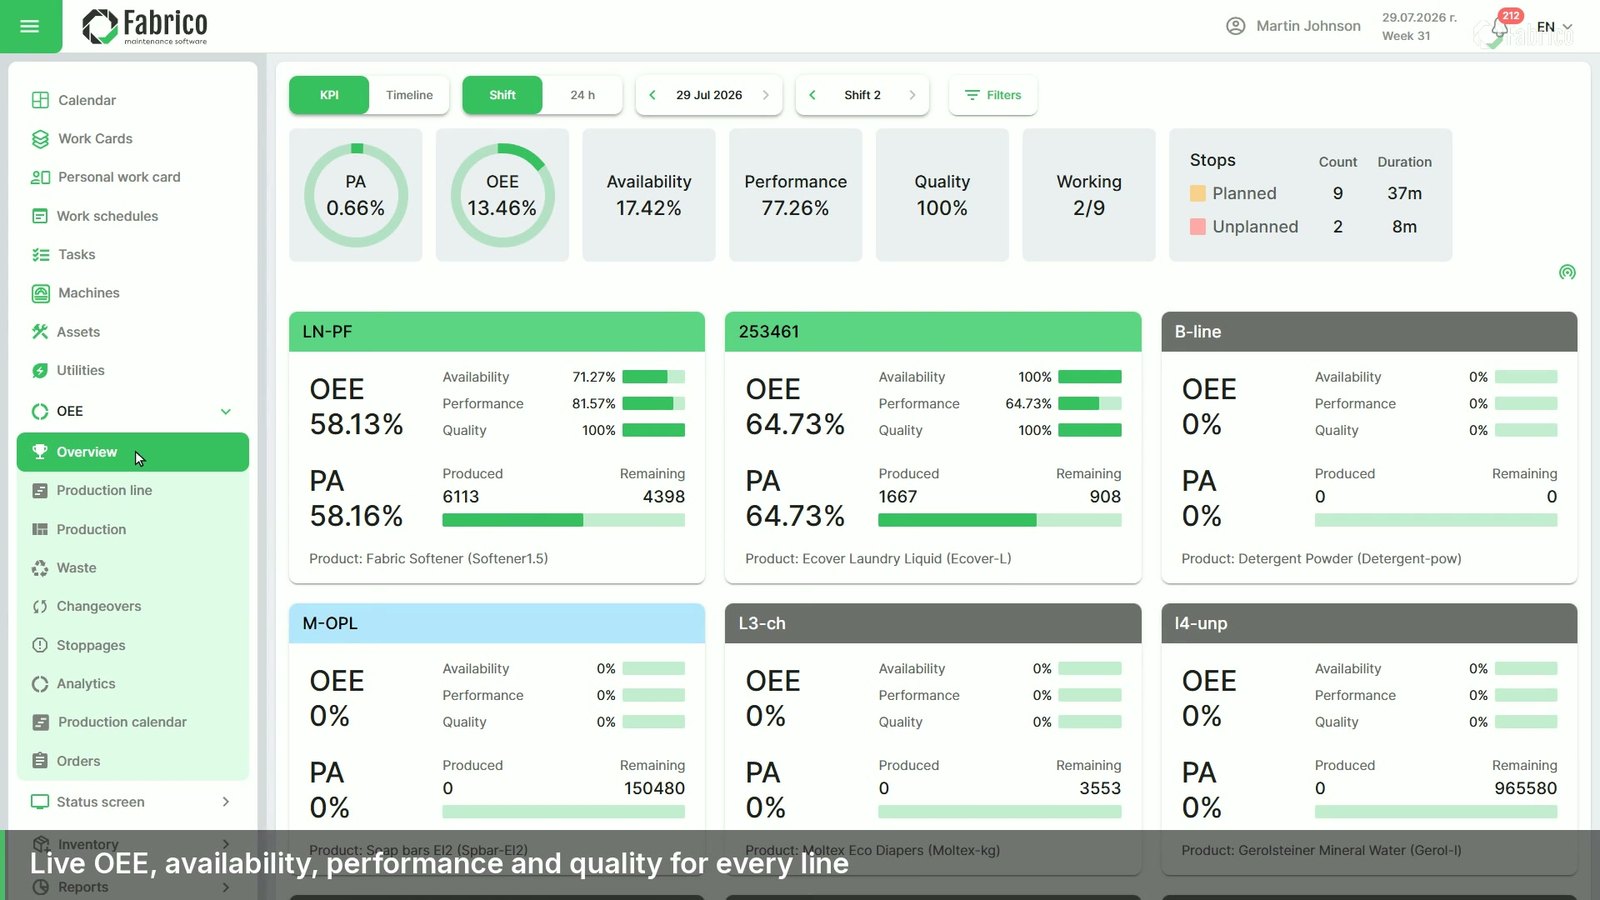
The weak number on this page is your lost hours. Fabrico takes them from the machines: every stop with its reason, per line and shift, through PLC signals, IoT sensors or cameras with computer vision. Your operator picks the reason at the line, during the stop.
Sooner or later someone in your plant says it: world class is 85%, we are at 60%, so we are bad. It is the wrong conclusion from the wrong comparison. This chapter shows you what the 85% means and what plants that measure honestly find.
The 85% figure goes back to Seiichi Nakajima's work on total productive maintenance in the 1980s. It was set as world class: the level of the best plants. It was never the level of a typical plant, and it was never a first-year target for a line that has just started to measure.
So if your plant is at 60%, you are not failing a standard. You are somewhere on a long scale that very few lines reach the top of. And if you see 85% after a few months of measuring, check the definition first. Chapter 3 shows you how a number gets there without anyone lying.
Source: Nakajima, S. (1988). Introduction to TPM: Total Productive Maintenance. Productivity Press. The usual source given for the 85% world class figure.
Two published studies give you a sense of the range. Both come from Chalmers University in Sweden, from different decades with different methods. Read them as reference points, not as a league table.
Across about 20 cases. OEE was "only around 55 per cent", and running slow and short stops were the biggest losses.
The average across 884 machines in 23 companies, recorded automatically. Most machines there showed 100% performance and quality, so the 65% mostly counts stops.
Sources: Ljungberg, Ö. (1998). International Journal of Operations & Production Management, 18(5), 495 to 507. Hedman, R., Subramaniyan, M., Almström, P. (2016). Procedia CIRP, 57, 128 to 133.
In the study of 884 machines, almost half of the recorded losses could not be classified, because the loss categories were missing or poorly described. Even with automatic measurement, half the lost time had no usable reason. A number without reasons tells you how much time you lose. It tells you nothing about where to start. That is why chapter 3 spends as long on reason codes as on the formula.
Source: Hedman, R., Subramaniyan, M., Almström, P. (2016). Analysis of critical factors for automatic measurement of OEE. Procedia CIRP, 57, 128 to 133.
If your line reports far above these ranges, check your definition before you celebrate. Check these four first:
If your line reports far below, check the shift calendar. A line measured against 24 hours when it is only staffed for 16 looks worse than it runs.
Do not set an OEE target in your first year. Set a target in hours. Take the top three losses from chapter 6 and aim to win back part of their hours on one line in 90 days, on the same definition before and after. OEE will move as a result, and nobody can say the gain came from a changed definition.
Compare your line with itself first: this month against its baseline, its best shift against its worst. The gap between your best and worst shift, on the same machines with the same products, is the most convincing target you will find. Your plant has already proven it can run that way.
| Which shift | Availability | Performance | Quality | OEE |
|---|---|---|---|---|
| All shifts | ||||
| Best shift | ||||
| Worst shift |
| # | Top loss | Hours, four weeks | Owner |
|---|---|---|---|
| 1 | |||
| 2 | |||
| 3 |
Your target: hours to win back on the top three by ______ (90 days), measured on the same definition.
No OEE target in the first year. Your hours are the target; OEE follows.
The same, run from the machinesComparing your line with itself only works if both sides use the same definition and the same data. Fabrico calculates availability, performance and quality per line and shift from the machines, with every stop and a reason picked at the line. Your best shift, your worst shift and your baseline come from one source.
If you measure OEE, you may have a number you do not quite believe. Nobody lies to you. Every small choice in how your number is built just leans the same way: toward a better number. A changeover booked as a planned stop. A speed target lowered after a bad week. Warm-up scrap binned before anyone counts it. Together, these choices make your line look better than it runs, and they hide the losses you most need to fix.
OEE is availability × performance × quality. You cannot "improve availability" on a Tuesday morning. You can act on a specific loss. The six big losses, from Nakajima's work, give every lost minute on your line one place to sit.
| Factor | Loss | What you see on the floor |
|---|---|---|
| Availability | Breakdowns | Equipment fails, your line stops for repair |
| Setup and adjustments | Changeovers, last good part to first good part | |
| Performance | Idling and minor stops | Short stops your operator clears alone |
| Reduced speed | The line runs below its ideal rate | |
| Quality | Startup rejects | Scrap after a start, before the process settles |
| Production rejects | Scrap and rework during steady running |
The six big losses: Nakajima, S. (1988). Introduction to TPM. Productivity Press.
One rule sits above all six: you capture losses from your machine, not from memory. A manual log keeps the long stops and loses the short ones, so your small losses disappear first.
Breakdowns: fix the repeats first. Each failure looks like bad luck on the day. The pattern only shows across days and shifts. Capture the stop with its start and end time, and let maintenance add the cause. Your first move: a work order for every breakdown over a threshold, causes ranked by hours, the top one removed. Owner: your maintenance lead.
02Changeovers end at the first good part. If you book a changeover as a planned stop, it drops out of OEE and nobody attacks it. Tag it as a changeover, and let the good count mark its real end. Your first move: film one changeover (chapter 9). Owner: your production lead.
03Minor stops never reach your shift log. A jam, a blocked sensor, an empty feeder, cleared in seconds. Together they can outweigh a breakdown. In one example shift your machine counts 18 stops and your shift log counts none. Your first move: count them by cause for a week and fix the most frequent one at your machine. Owner: your line supervisor.
04Reduced speed is the loss nobody hears. Your line runs, just slower than it can. Against a lowered "standard" rate, performance looks fine all shift. Compare the actual cycle time with one ideal cycle time per product. Owner: your process engineer.
05Startup rejects belong in the scrap count. After a start, the first parts are bad while settings settle. If they are called "warm-up" and binned, your quality looks better than it is. Your first move: a startup checklist, signed at the first good part. Owner: your shift lead.
06Production rejects: count rework too. A reworked part that joins the good count hides the loss. Count rework as a reject, with a defect reason. Your first move: rank defects by machine and shift, attack the top one. Owner: your quality lead.
The 18-stop shift is an example.
Read your own OEE definition against this list. Every yes means part of your number is not real.
Changeovers booked as planned stops. Planned stops come off before availability is calculated, so the changeover costs nothing on paper.
02Speed measured against a lowered rate. If the standard was relaxed after a bad week, you measure against the problem, not your machine.
03Startup scrap left out. Warm-up rejects that nobody counts make quality look better than your process is.
04Rework counted as good. A part that needed a second pass was not good the first time.
05Short stops lost from a manual log. Every stop nobody wrote down turns into "slow running" or disappears.
None of these needs bad intent. Each is a default somebody chose once and nobody revisited. Write your definition down, on one page, and review it with the people who build your number.
The six losses only help if every stop carries a reason, and reasons only help if your list stays clean. Six rules:
| Loss | How you capture it today | Lost hours, last week | Owner | First move |
|---|---|---|---|---|
| Breakdowns | ||||
| Setup and adjustments | ||||
| Idling and minor stops | ||||
| Reduced speed | ||||
| Startup rejects | ||||
| Production rejects | ||||
| Total |
A changeover is a loss, never a planned stop. Rework counts as a reject. One owner per loss: a person, not a department.
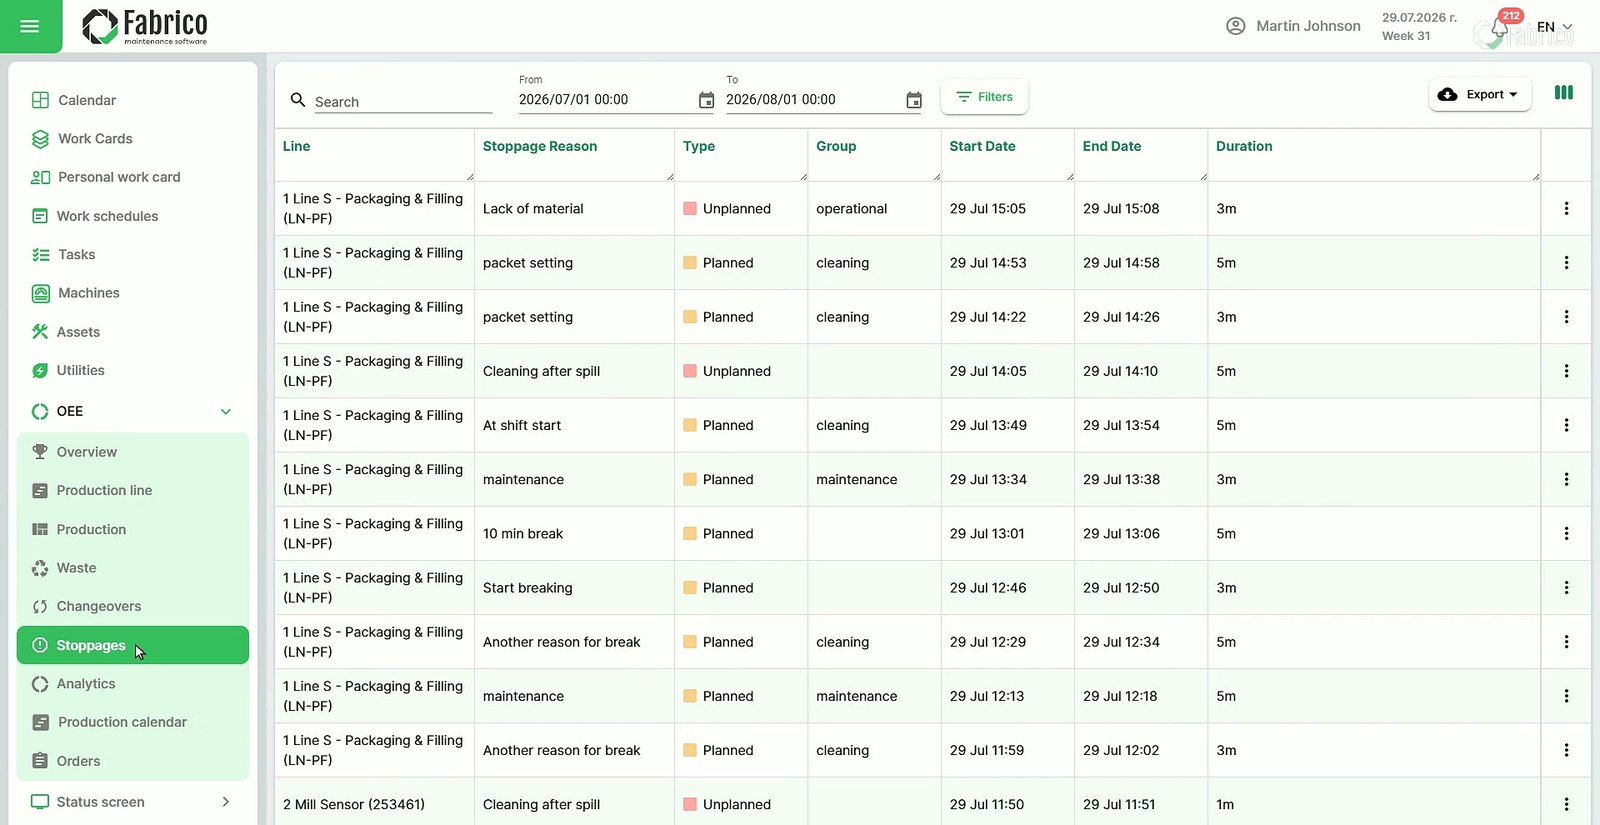
The same, run from the machinesMeasuring honestly is easier when your raw data does not depend on memory. Fabrico counts every stop from the machine, through PLC signals, IoT sensors or cameras with computer vision, and your operator picks the reason at the line while the stop is happening. Downtime shows by cause, line, machine and shift, and a breakdown can become a maintenance work card in the same system.
Every improvement starts with one question: better than what? If your starting number is soft, every later number is an argument. In this chapter you get a baseline for one line in one week that nobody in your plant will argue with, on paper if that is all you have.
Pick one line. Not your best and not your worst: the one whose losses your people talk about most. You learn more from one line measured properly than from ten measured roughly.
Get these five right in week one and many OEE arguments never start. Write each one down, with a name next to it.
| Input | What "right" means |
|---|---|
| Shift calendar | Planned production time per line, with breaks and planned stops agreed in writing |
| Machine states | Run and stop, with times, from your machine where you can, never from memory |
| Counts | Total and good parts per product, counted at the same point on every line |
| Ideal cycle time | One value per product and machine, from the design or the best proven rate |
| Scrap and rework | Recorded per machine and shift, with a reason |
The line you pick: ____________ Why this one: ____________________________
The one you will be tempted to skip is the ideal cycle time. If you take it from the "standard" rate your line was set to after a bad month, performance looks fine for ever. Chapter 3 called this the second way an OEE number gets inflated.
OEE is availability × performance × quality. Availability is run time ÷ planned time. Performance is ideal cycle time × total count ÷ run time. Quality is good count ÷ total count. Here is one shift, worked through.
| Input or result | Working | Value |
|---|---|---|
| Planned time | 480 min | |
| Stops | 60 min | |
| Ideal cycle time | 1.0 min a part | |
| Total / good count | 380 / 361 | |
| Availability | 420 ÷ 480 | 87.5% |
| Performance | 380 × 1.0 ÷ 420 | 90.5% |
| Quality | 361 ÷ 380 | 95.0% |
| OEE | 87.5% × 90.5% × 95.0% | 75.2% |
Example values with round numbers, not a typical value.
Here is a cross-check that never lies: OEE also equals good count × ideal cycle time ÷ planned time. Here, 361 × 1.0 ÷ 480 = 75.2%. If your two answers differ, one of your definitions is wrong. Better to find out in week one than in week ten.
As a waterfall, your losses become visible: 12.5 points to stops, 8.3 to speed, 4.0 to quality.
Day 1. Agree the definition. Sit down with production, maintenance and quality for one hour. Write down when your line is planned to run, and which breaks and planned stops come off. Decide now that changeovers are not planned stops. Everyone signs the page.
02Day 2. Fix the ideal cycle times. One value per product. Use the design rate, or the best rate your line has held for a full shift. Write down where each value came from.
03Day 3. Write the stop-reason list. Five to eight reasons, in your operators' words, each mapped to one of the six losses from chapter 3, plus one "Other" that someone reads every day. Put the list next to your line.
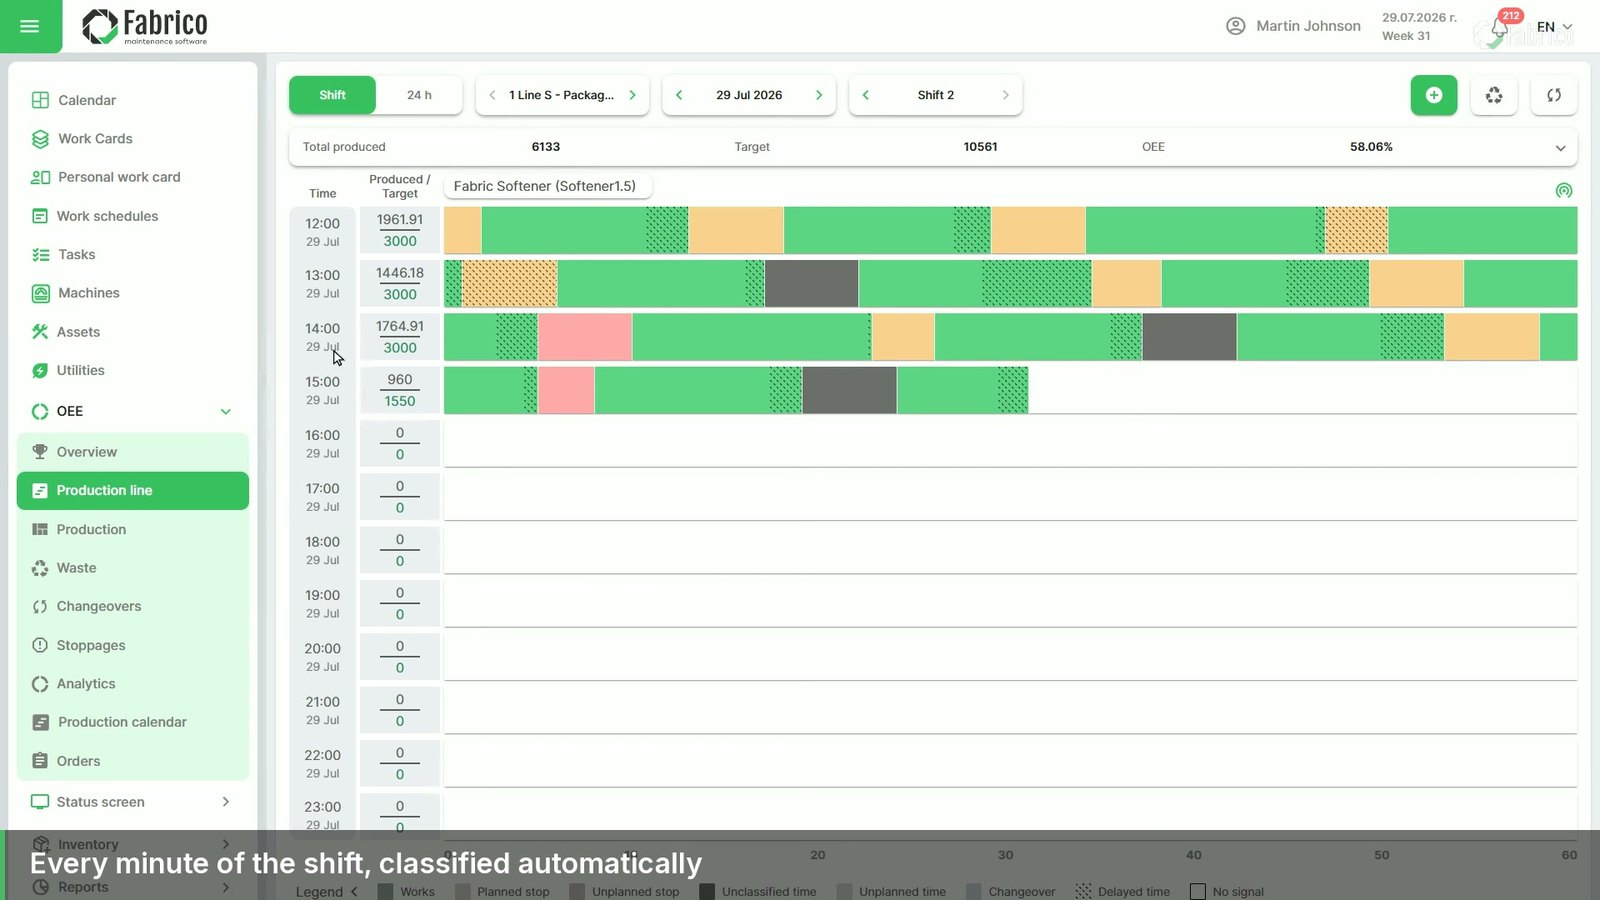
04Days 3 to 7. Record. Every stop with its start, its end and its reason. The total and good count at the end of every hour. Scrap and rework with a reason. If your machine can give you run and stop times, take them from your machine and let your operator add only the reason.
05Day 7. Calculate and cross-check. Availability, performance, quality and OEE for each shift, then the cross-check. Then add up the stop minutes by reason. That list is where chapter 6 starts.
A paper tick sheet gives you a good baseline for availability. It will understate your short stops, because a stop of fifteen seconds often goes unmarked, and it then shows up as slow running. That is fine for a first week, as long as you know it. Write one sentence under your baseline: "short stops under one minute are not in this count". Chapter 5 is about catching them.
One definition everyone signed, ideal cycle times with their sources, a reason list your operators use, and OEE per shift that passes the cross-check.
| Hour | Stops in this hour: start, end, reason code | Total | Good | Initials |
|---|---|---|---|---|
| 1 | ||||
| 2 | ||||
| 3 | ||||
| 4 | ||||
| 5 | ||||
| 6 | ||||
| 7 | ||||
| 8 |
Count total and good parts at the same point, at the end of every hour. Short stops under one minute are not in this count.
| Code | Reason, in your operators' words | Loss it belongs to |
|---|---|---|
| 1 | ||
| 2 | ||
| 3 | ||
| 4 | ||
| 5 | ||
| 0 | Other | Read by one named person every week |
Five to eight codes, plus one "Other". Each maps to one of the six losses: breakdowns, setup, minor stops, reduced speed, startup rejects, production rejects.
On paper, your week costs your operators a few minutes every hour, and it still misses the short stops. That is the trade you make for starting this week without buying anything. When you are ready to stop making that trade, this is what changes.
 The same, run from the machines
Fabrico records the machine states and counts for every line and shift from the machines, and your operator picks the reason at the line while the stop is happening. Availability, performance, quality and OEE come per line and shift in real time, on one definition. Your day 7 sums are there every morning, without a calculator.
Ask your shift lead how often your line stopped yesterday and you hear about the long stops: the breakdown at ten, the changeover after lunch. Ask your machine and you get a different answer, because many of its stops were too short to write down. A jam cleared in four seconds. A sensor wiped. A part pushed back into its guide. Each one is nothing. Together they are often one of the biggest losses on your line, and on paper they leave no trace.
A filling machine stops for four seconds when a bottle tips over. Your operator stands it up and your line runs again. It happens about once every two minutes.
| Step | Working | Result |
|---|---|---|
| Stops in 7 hours of production | 420 min ÷ 2 | 210 stops |
| Time stopped | 210 × 4 s | 14 min |
| Run-up after each stop (8 s at half speed) | 210 × 4 s | 14 min |
| Lost per shift | 28 min | |
| Lost per week (3 shifts, 5 days) | 28 × 15 | 7 hours |
Example values, not typical ones.
A full shift every week, lost in pieces of four seconds, and not one of them is in your shift log. Paper misses it for a simple reason: writing down a four-second stop takes longer than the stop. So shift logs use a threshold of a few minutes, and everything under it is cleared and forgotten. Nobody is hiding anything. The tool cannot see that small.
A stopped line is loud. A slow line is quiet. You walk past a machine that runs at 54 parts a minute instead of 60, because it is running.
| Over 420 minutes of running | Working | Parts |
|---|---|---|
| Ideal output | 420 × 60 | 25,200 |
| Actual output | 420 × 54 | 22,680 |
| The gap | 2,520 ÷ 60 = 42 minutes at the ideal rate | 2,520 |
Example values: ideal rate 60 parts a minute, actual 54.
Your line never stopped, so no stop log shows anything. And if the "standard" rate in your system was lowered to 54 after a bad month, performance reads 100% while your line gives away 42 minutes a shift.
Lost speed has causes. A line is turned down after a jam so the jam does not come back. A tool wears. A material runs badly. A new operator plays safe. You can fix each one, but only once you see the gap.
Before you install anything, one shift and a calculator show you whether there is a gap worth hunting:
Ideal output = planned time × ideal rate.
02Take away the output lost in the stops you logged: logged stop minutes × ideal rate.
03Take away the total count, good parts and rejects together.
04What is left went missing without a record: short stops and slow running.
Example: 420 minutes at 60 parts a minute is 25,200 parts. Your log shows 35 minutes of stops, so 2,100 parts. Your total count is 21,000. That leaves 2,100 parts: 35 minutes that nobody wrote down.
Example values.
To split your gap into short stops and slow running, watch your machine. One hour per shift, with a stopwatch, for one week. Count every stop, its length in seconds and its cause, and count the parts in the same hour. The stops give you the short stop share. The rest of the gap is speed. On three shifts, five days a week, that is fifteen hours of watching. Use them to name your first three causes. The first one is often fixed at your machine, not in a meeting.
The paper hunt proves the gap and finds your first causes. It cannot run every shift. For that, the count has to come from your machine, and you have three ways to get it.
| Method | What it sees | What you install | Where it fits |
|---|---|---|---|
| PLC signals | Run state and part count from the controller | Access to the controller, through the network or a gateway | Machines with a modern controller |
| IoT sensors | Motor running, parts passing | A sensor, power, a network connection | Older machines with no usable signal |
| Camera with computer vision | Parts and flow at the process area | A mounting point above your line, light, power, network | Manual stations, mixed parts, no signal at all |
PLC signals are the cleanest source where they exist, but you need the people who look after your machine's control, because they know which signal means what. A sensor added from the outside changes nothing in the control. A camera fits where neither can see. Many of your lines will end up with a mix: the method follows your machine, not your plant.
Whichever you pick, check its first week against your stopwatch hour. If the two counts disagree, trust neither until you know why.
The first question on your floor is often not technical. It is "is it filming me?", and it deserves an answer before the camera goes up, not after.
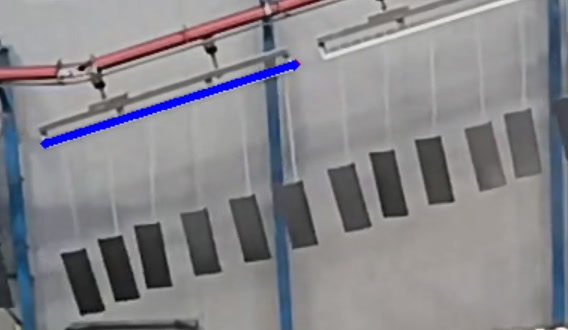
The process area: the parts, the conveyor, the station.
Video, recorded continuously in short segments linked to what your line was doing, so you can review a stop next to its machine data.
Fabrico runs on AWS in an EU region. The video itself can be kept in a private cloud for your plant alone, or on your own server.
Before installation day, ask your vendor two more questions in writing: how long is the footage kept, and who in your plant can see it? Give your crew all the answers in the same words, and let them see what the screen shows.
Then put one person on the floor who can answer the question when it comes up again. It will come up again, usually on the night shift.
Why it is there. We use it to find out why the line stops, not to judge people.
02Who sees it. Name the people or roles from your vendor's written answer, nobody else.
03How to check. Anyone on the crew can ask to see what it recorded on their shift.
| Day, shift | Planned min | Ideal output | Lost in logged stops | Total count | Missing min |
|---|---|---|---|---|---|
| Week |
Missing parts = ideal output minus logged-stop output minus total count. Missing minutes = missing parts ÷ ideal rate.
| # | Clock time | Length, s | Cause | What your operator did |
|---|---|---|---|---|
| 1 | ||||
| 2 | ||||
| 3 | ||||
| 4 | ||||
| 5 |
End the week with one cause to fix, not a list.
The same, run from the machinesFabrico counts every stop from the machine, through PLC signals, IoT sensors or cameras with computer vision, so your short stops are counted, not estimated. Slow cycles count as performance loss, not downtime. With hardware, installing and connecting the devices takes about a month, and the full rollout takes three to four months.
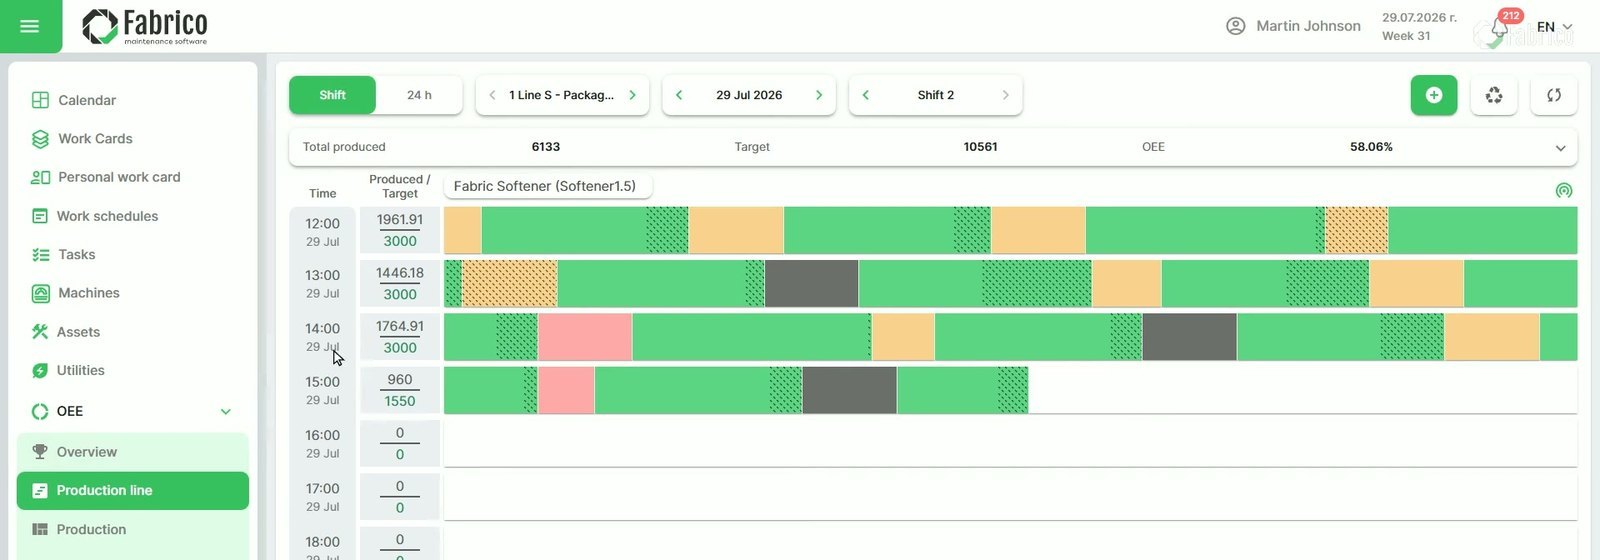
After your baseline week you have a list of every stop and its reason. You will be tempted to attack all of it. Your programme can die right there: ten actions, nobody quite owning any of them, and in six weeks your line looks the way it did before. In this chapter you choose three, and only three.
"Availability is down two points" does not tell your supervisor what to do on Tuesday. Hours do. An hour is something your supervisor can see, count and win back. Take two weeks of stop data, add up the hours lost per loss type, and sort.
| Loss type | Hours lost, two weeks |
|---|---|
| Changeovers | 18.0 |
| Breakdowns | 14.4 |
| Minor stops | 10.2 |
| Waiting | 5.4 |
| Startup rejects | 3.6 |
| Reduced speed | 2.4 |
| Total | 54.0 |
Example values. The top three hold 42.6 of the 54.0 hours.
A few loss types carry most of your time, and they are often not the ones your people complain about most loudly. Three rules keep your ranking honest:
Before you rank, check that every hour sits on the right branch of the loss tree: breakdowns and setup under availability, minor stops and reduced speed under performance, startup and production rejects under quality. If a big share of your hours sits under "Other", fix your reason list before you trust the ranking.
A loss without an owner is a statistic. For each of your three, name one person, not a department, and one first action that can start this week.
| Loss | Typical owner | First action |
|---|---|---|
| Breakdowns | Maintenance lead | A work order for every stop over a threshold; find the cause of the repeats |
| Changeovers | Production lead | Film the longest changeover; move steps outside the stop |
| Minor stops | Line supervisor | Reason codes your operators will use, five to eight per line |
| Reduced speed | Process engineer | Running rate against ideal rate, per product |
| Startup rejects | Shift lead | A startup checklist, signed at the first good part |
| Production rejects | Quality lead | Scrap by machine and shift, reviewed with the loss owner |
Then run one countermeasure per loss every two weeks. Nothing counts as done until the loss hours fall in your data. A countermeasure that "should have worked" and shows nothing in the hours did not work.
| Rank | Loss type | Hours lost | Share | Running total |
|---|---|---|---|---|
| 1 | ||||
| 2 | ||||
| 3 | ||||
| 4 | ||||
| 5 | ||||
| 6 | ||||
| Total | 100% |
| # | Loss | Owner, a person | First action | Hours before | Hours after |
|---|---|---|---|---|---|
| 1 | |||||
| 2 | |||||
| 3 |
Before and after: two weeks each, on the same definition. Done means the hours fell.
The same, run from the machinesYour ranking is only as good as the stop data under it. Fabrico shows downtime by cause, line, machine and shift, from the machines, for the current shift, last week or a past month, so the ranking is there without a spreadsheet. From a stop, a technician can open a work card for its owner in the same system.
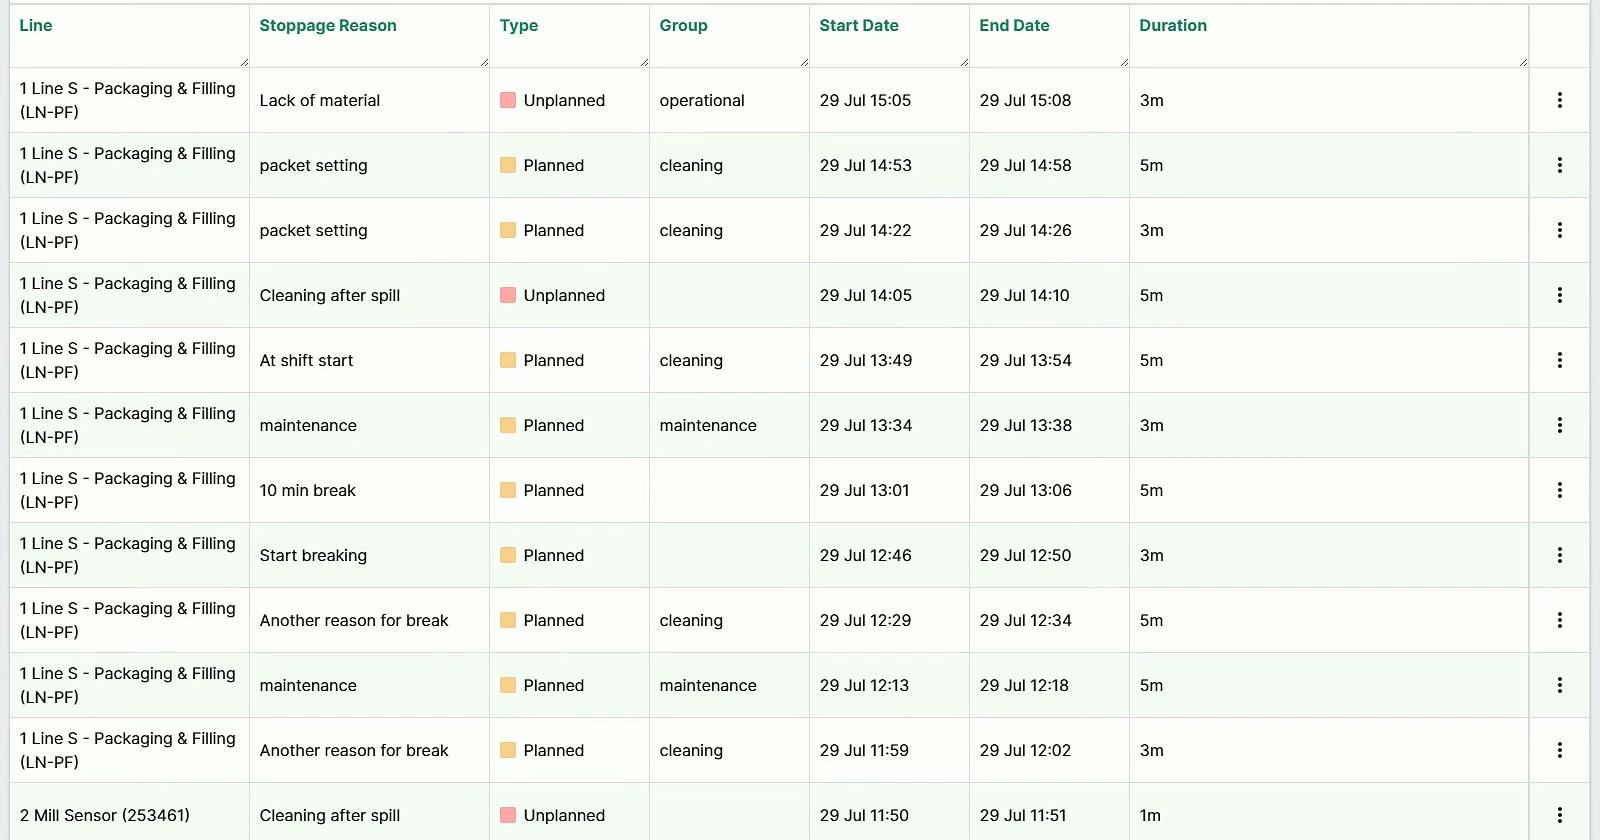
In many plants the morning meeting is where yesterday gets argued about. Whose numbers are right, why your line stopped, who should have called whom. It runs long, it ends without decisions, and by ten o'clock your day has already gone the way it was going to go.
In this chapter you run a different meeting: ten minutes, standing, at your line, about today. It works because it uses the same loss hours as your Monday review in chapter 10, and because it decides instead of discusses.
Your meeting has one board and one agenda, and both stay the same every day. When the agenda stays the same, your people prepare the numbers, not a speech.
| Minutes | Item | What is said |
|---|---|---|
| 0 to 2 | Yesterday in hours | Planned hours, lost hours, against the target. No debate on your number. |
| 2 to 5 | The top losses yesterday | The two or three biggest stop reasons in hours, and what happened |
| 5 to 8 | Actions | Due today, done, blocked. Every blocked action gets a decision now. |
| 8 to 10 | Today | Anything that will stop your line today: material, a maintenance window, a changeover, people |
Your shift lead runs your meeting. Maintenance and quality are there, because many actions need one of them. You, the plant manager, listen, and speak only to decide what is blocked. If the most senior person in the room talks most, your meeting becomes a report to that person, and the people who know what happened stop saying it.
An action is done when the loss hours it targets fall in your data, not when someone says it is done. "We fixed the sensor" closes when the stops on that sensor stop appearing. Until then it stays on your board. That is not a judgement on anyone. It is what keeps your board honest.
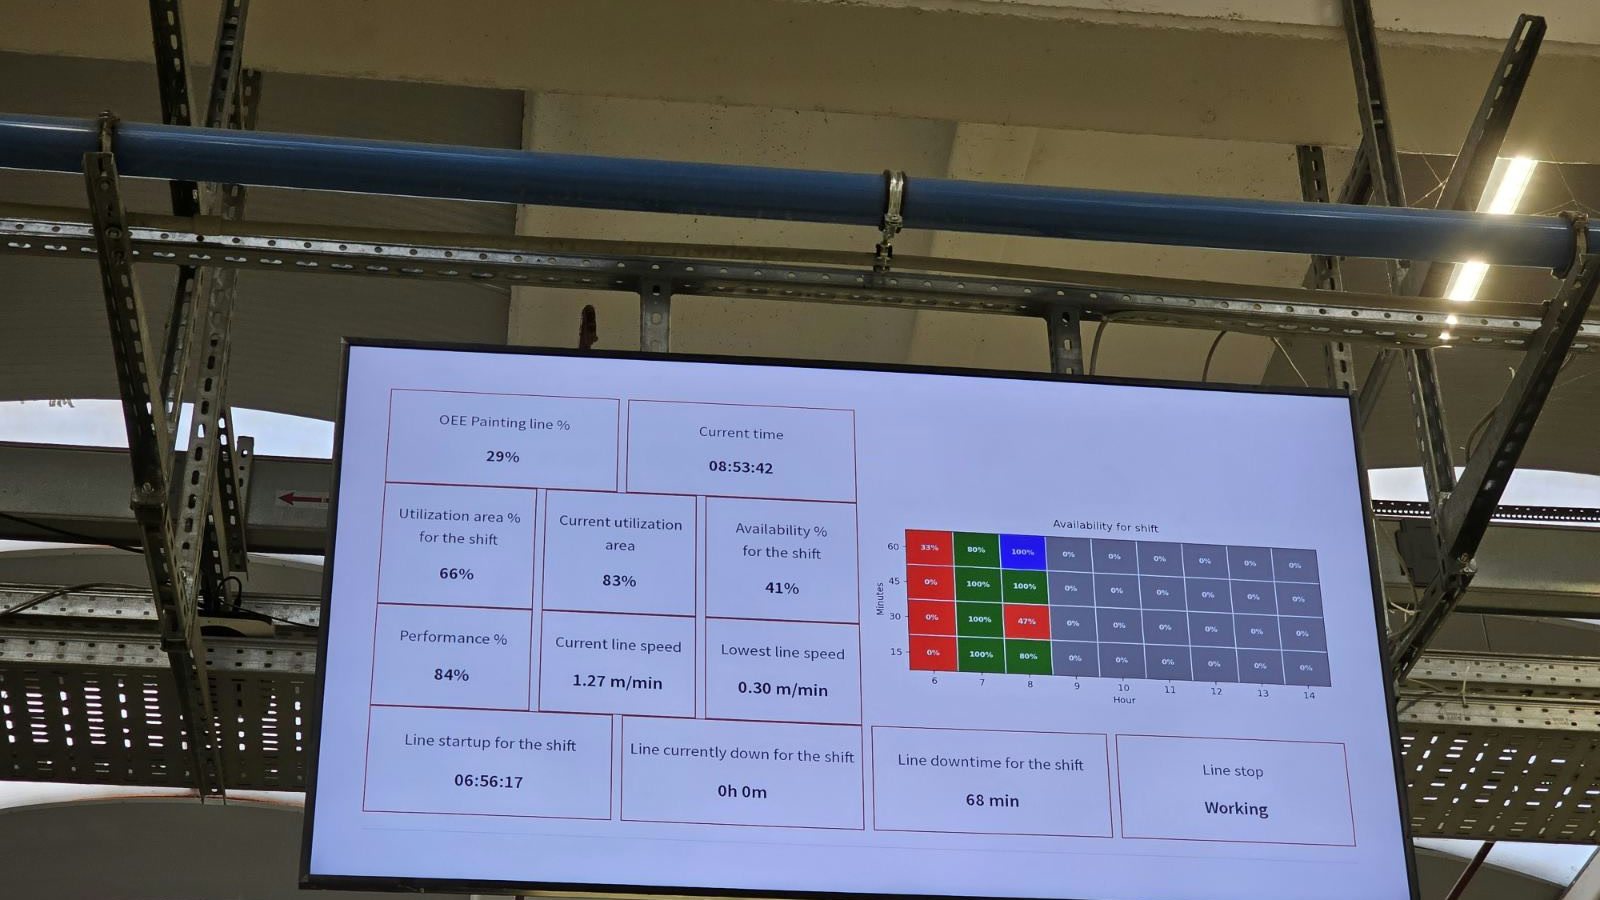
Ten minutes a day is fifty minutes a week. Compare that with the hours you saw in chapter 1. If your meeting takes back even one stopped hour a week, it is the best-paid fifty minutes in your plant.
Lost hours by reason, per line, against the target
From chapter 6: owner and this week's hours
One owner, one date each: due today, done, blocked
Products, changeovers, planned maintenance, people
An action is done when its loss hours fall in your data.
The same, run from the machinesYour meeting is only as good as yesterday's numbers, and paper numbers often arrive late. In Fabrico, the meeting-room screen shows yesterday's downtime by cause, line and shift, and a TV by the line shows the live state, so your whole crew sees a long stop while it is happening.
When your line stops, two records start. Production writes down that your line stopped, for how long, and maybe why. Maintenance writes down what they repaired, with which parts, in how many hours. Both are correct. They are kept by different people, in different places, with different words, and no record shows which repair fixed which loss. That gap is one reason the same failure comes back. In this chapter you close it.
Look at one breakdown from both sides.
| Production's record | Maintenance's record | |
|---|---|---|
| What | Line 2 stopped | Replaced the bearing on the conveyor drive |
| When | 14:32 to 15:10 | Job opened 14:40, closed 15:25 |
| Why | "Mechanical" | "Worn bearing" |
| Where it lives | Shift log, OEE sheet | Work order system, notebook |
Example records.
Both are true. Neither tells you that this is the third bearing on the same drive this quarter, because your stop log does not know about bearings and the work order does not know about lost hours.
Line 2 has stopped three times this quarter for the same bearing. Each time, both records were correct. Each time, nobody connected them.
You do not have a bearing problem. You have a record problem.
The fix is a handover at the stop, not at the end of the shift.
The stop is detected with its start time, from your machine where you can.
02Your operator picks the reason from the short list (chapter 4), while the stop is happening.
03If the reason needs maintenance, a technician opens a work card from the stop itself. It carries your line, your machine, the reason and the start time. They are typed once.
04Your technician closes the card with the cause found, the action taken and the parts used.
05The stop ends when your line makes good parts again, and its length goes into the same record as the repair.
A single breakdown can be bad luck. The same failure three times is missing history. Once your stops and repairs share a record, three questions become a quick search instead of a meeting:
The repeats are where a preventive task belongs. If the same bearing fails every six weeks, you change it every five, on a plan, before it stops your line.
The other half of many long breakdowns is the part. The machine is down, and the part is "somewhere in your store". Two habits shorten those stops: write off every part against the work card that used it, so your store knows what left and why, and give the parts behind your repeats a minimum stock, so the next failure does not wait for an order.
| Who | Field | Write it here |
|---|---|---|
| At the stop · the operator | Line and machine | |
| Stop start (time) | ||
| Reason picked at the line (code) | ||
| Work card number | ||
| At the repair · the technician | Cause found | |
| Action taken | ||
| Parts used, and how many | ||
| At the restart · both | Stop end (first good part) | |
| Lost minutes |
The card opens from the stop, so line, machine, reason and start time are written once. The same failure three times in a quarter means a preventive task belongs there.
At the stop. Your operator fills the top four lines before calling maintenance. The clock starts at the stop, not at the call.
02At the repair. Your technician fills the cause, the action and the parts before the card is closed. No cause, no close.
03Once a week. Sort your cards by machine and reason, and add up the lost minutes in each pile. The biggest pile is your next fix.
This is the chapter where production and maintenance become one story. On paper, the handover card does it by hand. In a system, the stop and the work card are the same record from the first second.
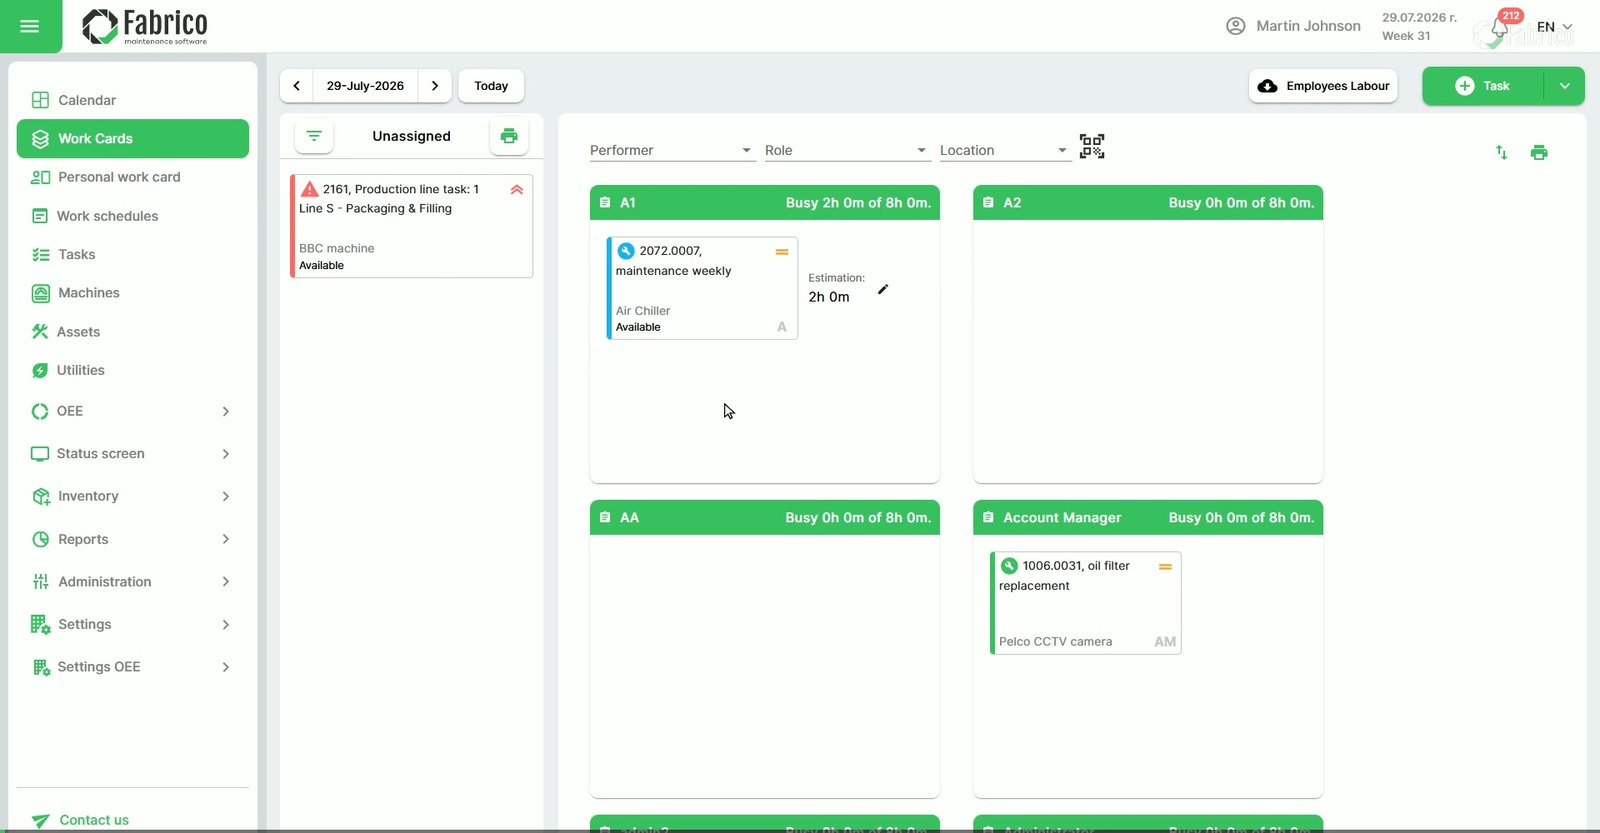
Check your own paper cards against this. If the same line, machine and start time are written by three people in three places, you have found the hours your handover loses.
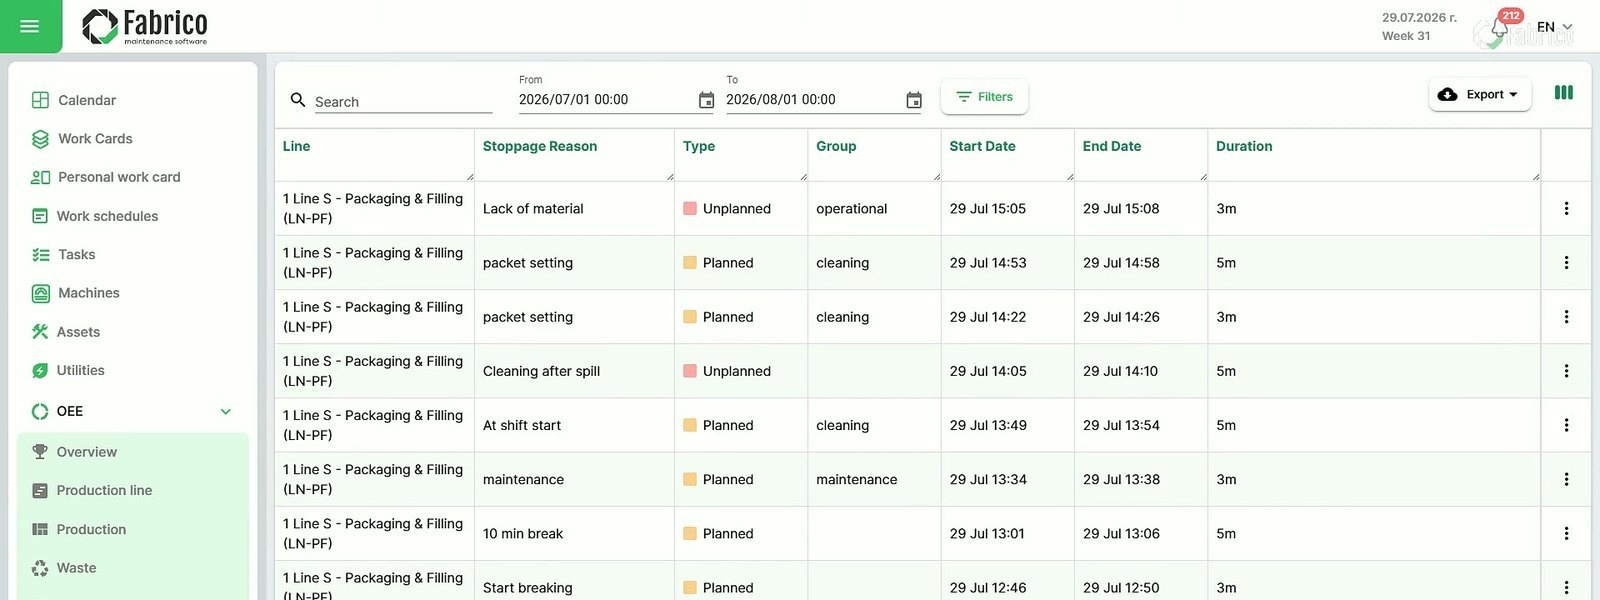
The same, run from the machinesFabrico keeps production and maintenance in one system. A stop is counted by the machine and its reason is picked at the line. When it needs a repair, a technician opens a work card from the stop and takes the job on a phone or tablet, with the machine and its priority. Technicians write off the parts they use against the work card, with a notification when stock falls below its minimum, and a preventive plan with recurring tasks can cover the failures that keep coming back.
Your plant has two changeover times. The one on the schedule, and the one on a stopwatch that runs from the last good part of the old product to the first good part of the new one. Nobody lies about the first. "Done" just gets said when your machine starts, not when the first good part comes out, and the minutes in between belong to nobody.
In this chapter you time the second number, and you take the first ten minutes out without buying anything.
A changeover starts at the last good part and ends at the first good part. Everything in between counts: fetching tools, cleaning, the tool change, the first runs that come out wrong, the adjustment, the second adjustment. If your stop log closes the changeover when your machine starts again, every minute of adjustment moves from setup into "slow running" or "startup scrap". The loss quietly changes branches on your loss tree.
The standard method goes back to Shigeo Shingo's single-minute exchange of die. You do not need the whole method to start. You need one phone, one changeover, and one hour afterwards with your people who did it.
Film your longest regular changeover, from the last good part to the first good part.
02Watch it together and write down every step, with its time.
03Mark each step inside (your machine must be stopped) or outside (it could be done while the old product is still running).
04For every outside step done during the stop, write down who could do it before the stop, and when.
You will be surprised by what most teams find: how much of your stop is walking and waiting.
Move outside work outside. Tools, material, the next product's settings and the inspection gauge are ready at your line before the stop starts, from a checklist. This costs you nothing but discipline.
02Turn inside work into outside work. Pre-assemble what can be pre-assembled, pre-heat what can be pre-heated, stage the next tool next to your machine. Each step you move shortens the stop by its full length.
03Take the guessing out of adjustment. Much of the adjustment time is your line searching for settings it has found before. Write down the settings that gave good parts, per product, on a card at your machine, and start from them.
A filmed changeover takes 45 minutes from the last good part to the first good part.
| Step | Before, min | After, min | The move |
|---|---|---|---|
| Fetching tools and material | 10 | 0 | Moved outside, onto a checklist done before the stop |
| Cleaning | 8 | 8 | |
| Tool change | 12 | 12 | |
| Adjustment until parts are good | 15 | 5 | A settings card per product |
| Last good part to first good part | 45 | 25 | 20 minutes off, nothing bought |
Example values, not typical ones.
On your line, with two changeovers a shift, that is 40 minutes of running time a shift. Over a five-day week on three shifts, it is ten hours.
40 minutes × 15 shifts = 600 minutes, from the example above.
| # | Step | Min | Inside or outside | Can it move out? | Who, and when |
|---|---|---|---|---|---|
| 1 | |||||
| 2 | |||||
| 3 | |||||
| 4 | |||||
| 5 | |||||
| 6 | |||||
| 7 | |||||
| 8 |
| Timed end to end | Changeover 1 | Changeover 2 | Changeover 3 | Average |
|---|---|---|---|---|
| Before, minutes | ||||
| After, minutes |
The good count marks the end, not the green light. A changeover is a loss, never a planned stop.
The same, run from the machinesFabrico records a changeover as a stop, with the reason picked at the line, so changeover minutes show by line and shift next to every other loss, and the stop minutes before and after each move show without a stopwatch. The machine's stop ends at the restart, so time the run-up to the first good part by hand, as above.
The first nine chapters were about one line: what its stops cost, how you measure them honestly, how you pick three and attack them. In this chapter you put it together into two things you can hand to other people: a 90-day plan your plant can run, and a one-page case your finance team can sign.
OEE rises when every loss has an owner, not when your number is on a screen. Your plan has four phases over thirteen weeks, and one meeting every Monday keeps it moving.
One line, one owner who answers for it, and the definition from chapter 4, signed.
| Weeks | Phase | What happens | What you have at the end |
|---|---|---|---|
| 1 to 2 | Baseline | Agree the definition, get data flowing (chapter 4) | OEE per line and shift, on one signed definition |
| 3 to 4 | Rank | Loss hours per type, pick three (chapter 6) | A loss register: the top three, each with an owner |
| 5 to 10 | Fix | One countermeasure per loss every two weeks | Loss hours before and after, per countermeasure |
| 11 to 13 | Lock in | Fixes go into standard work and maintenance plans | A new baseline, and the next three losses chosen |
Two weeks per countermeasure is a pace, not a law. If a fix waits on a part, start on the next loss while you wait, and keep the Monday review either way.
The engine of your plan is one review every Monday, with the same data and the same agenda. In the room: you, and your production, maintenance, quality and continuous improvement leads.
| Minutes | Item | What is said |
|---|---|---|
| 0 to 5 | OEE against baseline | Per line, last week against the baseline. No debate on your number. |
| 5 to 15 | Top three losses | Hours this week against last week, per owner |
| 15 to 22 | Countermeasures | Done, in progress, blocked. Blocked items get a decision today. |
| 22 to 27 | New losses | Anything that crossed its threshold since last Monday |
| 27 to 30 | Decisions | Owner and date for every decision, read back aloud |
Chasing OEE points instead of loss hours. Changing what counts as a planned stop halfway through, which erases your progress on paper. Relying on manual logs, so short stops go unrecorded. Reviews that end without an owner and a date, which makes them reports.
Your finance director signs money and risk, not OEE points. Your case has three steps: hours, measured rather than estimated; money, with each hour priced once; and months: when the cash comes back, and what waiting costs.
| Driver | What changes | Input you need | Who has it |
|---|---|---|---|
| Capacity recovered | You sell more from the same lines | Margin per hour, and demand for the extra output | Finance, sales |
| Overtime and labour | Fewer extra shifts to hit the plan | Overtime hours and cost per hour | HR, production |
| Maintenance cost | Fewer emergency repairs and rush parts | Reactive repair spend per year | Maintenance |
| Scrap and rework | Fewer bad parts at start-up and in the process | Scrap cost per unit, rework hours | Quality, finance |
| Energy while idle | Less power drawn while your line waits | kW drawn at idle, price per kWh | Facilities |
Capacity only counts if your market takes the extra output. If it does not, value the same hours as labour and energy saved.
Send this list in week one, and give every number an owner and a source:
Planned production hours per line
02Lost hours by type per line
03Margin per unit or per machine hour
04Labour cost per hour, with the overtime premium
05Scrap cost per unit
06Reactive maintenance spend per year
07Energy drawn at idle, with its price
Three rules keep your case honest. Count each hour once: an hour sold as output is not also saved overtime. Your measured loss hours are the ceiling: you cannot win back more than you lose. And use the low estimate: a case that survives it is easier to sign.
One example line, one year. It loses 600 measured hours. The case claims 250 of them and leaves 350 unclaimed.
| Driver | Inputs | A year |
|---|---|---|
| Capacity | 150 hours × €400 margin an hour | €60,000 |
| Overtime | 100 hours × €120 crew cost an hour | €12,000 |
| Scrap | 2,000 units × €6 a unit | €12,000 |
| Value a year | €84,000 | |
| Value a month | €84,000 ÷ 12 | €7,000 |
Example values, not typical ones.
Ask every vendor for one-time and yearly cost, in writing, and check that the total covers five items:
Monthly net value = monthly value minus yearly cost ÷ 12. Payback in months = one-time cost ÷ monthly net value. For the example line, a 12-month payback needs one-time plus yearly cost of at most €84,000.
| The risk | How you shrink it |
|---|---|
| The rollout stalls | Start with one pilot line, prove the value there, then scale. |
| The number is not trusted | Agree planned time, stop reasons and ideal cycle times before day one. |
| Finance cannot check it | Measure before and after: the same line, the same definitions, the same number of weeks. |
| Nobody is accountable | Name one owner who answers for the pilot and the result. |
And show the cost of doing nothing. The example line loses 600 hours a year: 50 hours for every month the decision waits. In money, every month of waiting costs one month of net value.
In hours a year
In euros a year, and from which drivers
One-time and yearly
In months, from your quote
Its line, its length, its owner
An amount and a date
If you can say it in one breath, your slide is ready: we lose this many hours a year; winning back these is worth this much; it pays back in this many months.
The same, run from the machinesBoth halves of this chapter rest on one number: lost hours, measured. Fabrico takes the stops from the machines, and your operator tags each stop with its cause, so you see downtime by cause, line, machine and shift. With hardware, installing and connecting the devices takes about a month, and the full rollout takes three to four months, so your first baseline may be taken by hand. Hosted on AWS, ISO 27001 certified by DNV.
Everything in this guide works on paper first. When you want it to run every shift without the paper, you will look at systems. If your choice goes wrong, it will be on scope and data, not on features. This chapter gives you three steps: know what you are buying, weight twelve questions before any vendor presents, and make them show it live.
Pick your scope first. Each column usually includes the one to its left. Score vendors only against the scope you chose.
| Production monitoring | OEE software | MES | |
|---|---|---|---|
| What it records | Run and stop states, counts and speed | Stop reasons, ideal cycle times and scrap: the inputs for OEE | The OEE picture plus the work around it: maintenance, quality and shift records |
| Who uses it | Supervisors and line leads | Plant managers, CI and maintenance leads | Production, maintenance, quality and leadership, from one record |
| You need it when | Nobody knows which lines are running | Lines stop, but nobody knows which loss costs most | Each department keeps its own version of what happened |
Monitoring, OEE software and MES are different scopes. Choose one, then compare like with like.
Agree what matters most with production, maintenance and IT, before any vendor presents.
A stop arriving, a reason added, OEE moving, a work order raised. On screen, not in slides.
Take the steps in order. If you skip the first one, you score vendors against the wrong scope, and your best score can still be the wrong system.
Agree the weights with production, maintenance and IT before any vendor presents: 3 for a must-have, 2 for important, 1 for useful. Then score each answer from 1 to 5.
| No. | Your question | Why it matters | Weight |
|---|---|---|---|
| Q1 | Where does machine data come from, and how fast? | Manual logs miss short stops and arrive late | |
| Q2 | How are stops and their reasons captured? | An unexplained stop cannot be ranked or fixed | |
| Q3 | Can we see exactly how OEE is calculated? | Two systems can give one shift two OEE values | |
| Q4 | How are reason codes set up, and by whom? | Codes must fit your lines and stay stable | |
| Q5 | What does your operator screen look like? | If your operators avoid it, every number is wrong | |
| Q6 | How are alerts set, and who receives them? | An alert nobody owns is noise | |
| Q7 | Does a loss link to a maintenance action? | Losses only fall when someone acts on them | |
| Q8 | How does it handle several lines and sites? | Comparisons need one definition everywhere | |
| Q9 | What does IT need to approve it? | IT questions asked late stall the project | |
| Q10 | Who owns your data, and can we export it? | Your history should outlive any contract | |
| Q11 | What does rollout on one line look like? | A real plan shows they have done it before | |
| Q12 | How is pricing structured? | The pricing unit decides what growth costs |
| Score | 1 | 2 | 3 | 4 | 5 |
|---|---|---|---|---|---|
| Means | No answer, or a red flag | Described, not shown | Shown, with workarounds | Shown live, small gaps | Shown live, fits as is |
Score % = sum of (score × weight) ÷ (5 × sum of weights). A score of 1 on a weight 3 question rules the vendor out.
| Q1 | Q2 | Q3 | Q4 | Q5 | Q6 | Q7 | Q8 | Q9 | Q10 | Q11 | Q12 | Sum | |
|---|---|---|---|---|---|---|---|---|---|---|---|---|---|
| Weight | 3 | 3 | 3 | 2 | 2 | 1 | 3 | 1 | 3 | 2 | 2 | 2 | 27 |
| A score | 4 | 5 | 3 | 4 | 4 | 3 | 5 | 3 | 4 | 2 | 4 | 3 | 44 |
| A points | 12 | 15 | 9 | 8 | 8 | 3 | 15 | 3 | 12 | 4 | 8 | 6 | 103 |
| B score | 3 | 2 | 2 | 5 | 5 | 5 | 2 | 5 | 3 | 4 | 3 | 5 | 44 |
| B points | 9 | 6 | 6 | 10 | 10 | 5 | 6 | 5 | 9 | 8 | 6 | 10 | 90 |
The most you can score is 5 × 27 = 135. Vendor A: 103 ÷ 135 = 76.3%. Vendor B: 90 ÷ 135 = 66.7%. Their raw scores tie at 44. Your weights decide.
Example scores, not real vendors.
| Question | Weight | Vendor A | Vendor B | Vendor C |
|---|---|---|---|---|
| Q1 to Q6, points | ||||
| Q7 to Q12, points | ||||
| Total points | ||||
| Score % | ||||
| Any 1 on a weight 3 question? |
Send this script to every vendor one week before the demo. Ask for each item on a real screen.
Timestamped, with nobody typing it. You note the delay.
On the real operator screen, in your operators' language.
Availability, performance and quality move. You open the definitions.
You see a stop of a minute or two, not only the long ones.
Assigned to a named person in maintenance.
One line, one shift: stops, reasons, counts and scrap.
Added live. You ask who is allowed to do it.
You set a threshold, trigger it, and see who receives it.
You see the same definitions and screens, side by side.
Exported to a file you can open without the vendor.
After each demo, score the twelve questions while it is fresh. After the last one, fill your decision grid on the worksheet page.
Listen for these answers in every demo. A red flag scores 1 on its question. On a weight 3 question, that ends the vendor's chances.
| Q | Red flag | What you hear | Why it costs the deal |
|---|---|---|---|
| Q3 | Hidden definitions | "It's calculated automatically." | You cannot check the maths yourself. |
| Q1 | Manual entry only | "Operators log it at shift end." | Short stops never reach your data. |
| Q10 | No export | "Our reports cover everything." | Your history stays inside their system. |
| Q9 | No answer on security | "We'll check with our IT." | Your IT review stalls at the end. |
| Q11 | "It depends" on rollout | "Every plant is different." | No first-line plan, no steps, no owner. |
| Item | Ask for |
|---|---|
| Security certification | The certificate, its scope and the certifying body |
| Hosting | The cloud provider and the region where your data is stored |
| Single sign-on | Login with company accounts, and how leavers are removed |
| ERP integration | What flows each way, and who builds and maintains it |
| Quality system | How scrap and quality records reach your quality system |
| Data ownership and export | Contract wording, the export format, your data after exit |
| User roles | Who can view, edit and configure, per site and per line |
Collect all seven before your shortlist. A slide is not an answer. Ask for each one in writing and file it with your scorecard, so the answer you scored is the answer you sign.
When you want this method to run every shift without the paper, this is where we fit. Fabrico is a cloud-based MES and OEE platform for manufacturers, with maintenance management (CMMS) built in. Your machine data, your stops with their causes, your work cards and your reports live in one place.
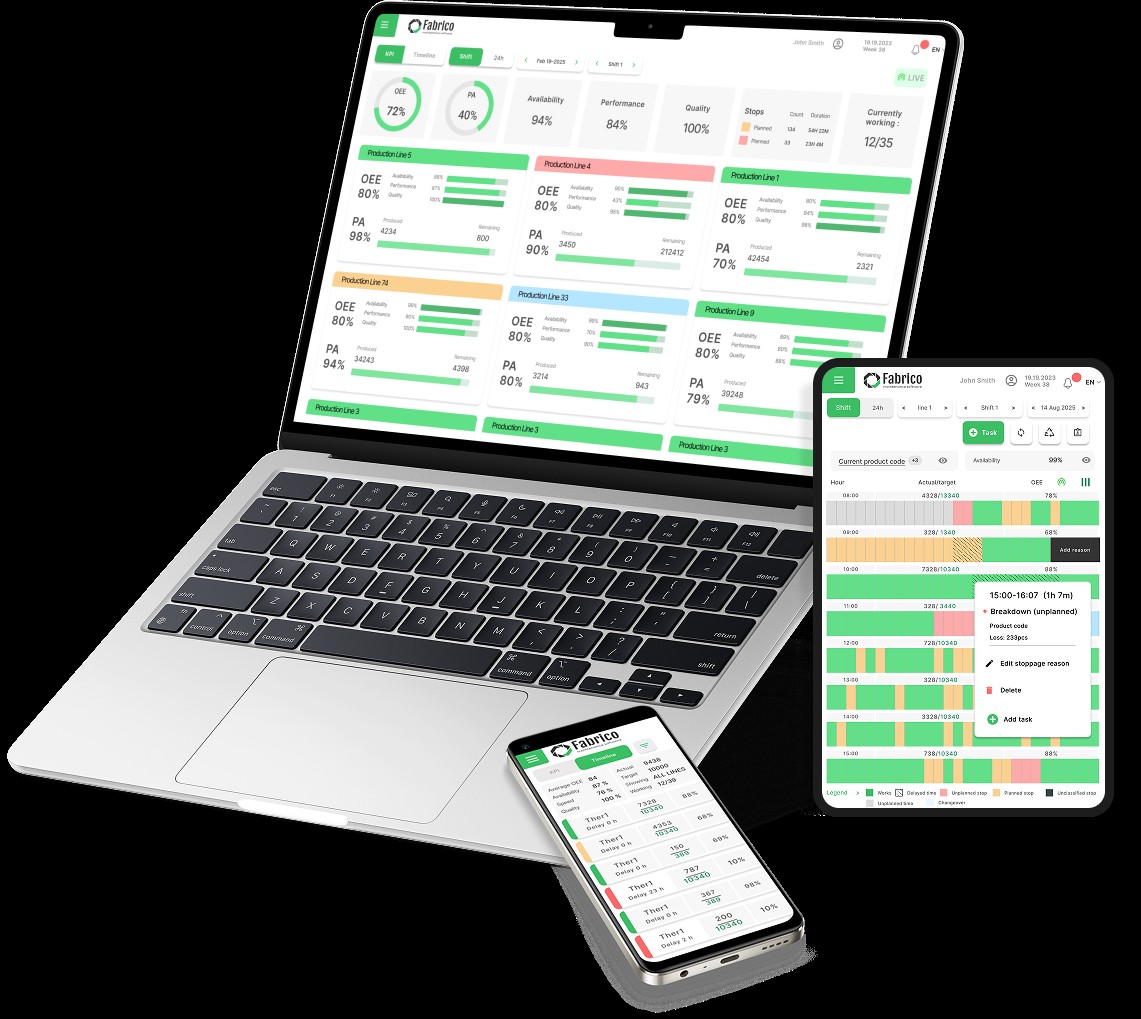
We make money when your plant decides to run this method in Fabrico. You may run it on paper first, and that is fine: the method works either way.
A 30-minute demo with a Fabrico consultant, on a line like yours, with your questions. No commitment. Bring the cost of one hour from chapter 1, or your scorecard from chapter 11.
Or e-mail team@fabrico.io with the subject line "Why lines stop" and the loss you want to win back. A consultant replies to set up the 30 minutes.
fabrico.io · ISO 27001 (DNV) · hosted on AWS
Every published figure in this guide comes from the sources below. Worked examples use round numbers and say so on their page. If you disagree with a number, disagree with the source.
| Where | Source | What it gives you |
|---|---|---|
| Ch. 2, 3 | Nakajima, S. (1988). Introduction to TPM: Total Productive Maintenance. Productivity Press. | The six big losses; the usual source for the 85% world class figure |
| Ch. 2 | Ljungberg, Ö. (1998). Measurement of overall equipment effectiveness as a basis for TPM activities. International Journal of Operations & Production Management, 18(5), 495 to 507. doi 10.1108/01443579810206334. | OEE around 55% across about 20 cases |
| Ch. 2 | Hedman, R., Subramaniyan, M., Almström, P. (2016). Analysis of critical factors for automatic measurement of OEE. Procedia CIRP, 57, 128 to 133. doi 10.1016/j.procir.2016.11.023. | An average OEE of 65% across 884 machines in 23 companies; almost half of the losses unclassified |
| Ch. 9 | Shingo, S. (1985). A Revolution in Manufacturing: The SMED System. Productivity Press. | Single-minute exchange of die: inside and outside work |
Why Lines Stop · published by Fabrico · October 2026 · team@fabrico.io
The acronyms used in this guide, in plain English. Tap a dotted term anywhere in the text to see its meaning in place.