Login

How Ficosota raised OEE from 53.1% to 59.6% on 16 lines
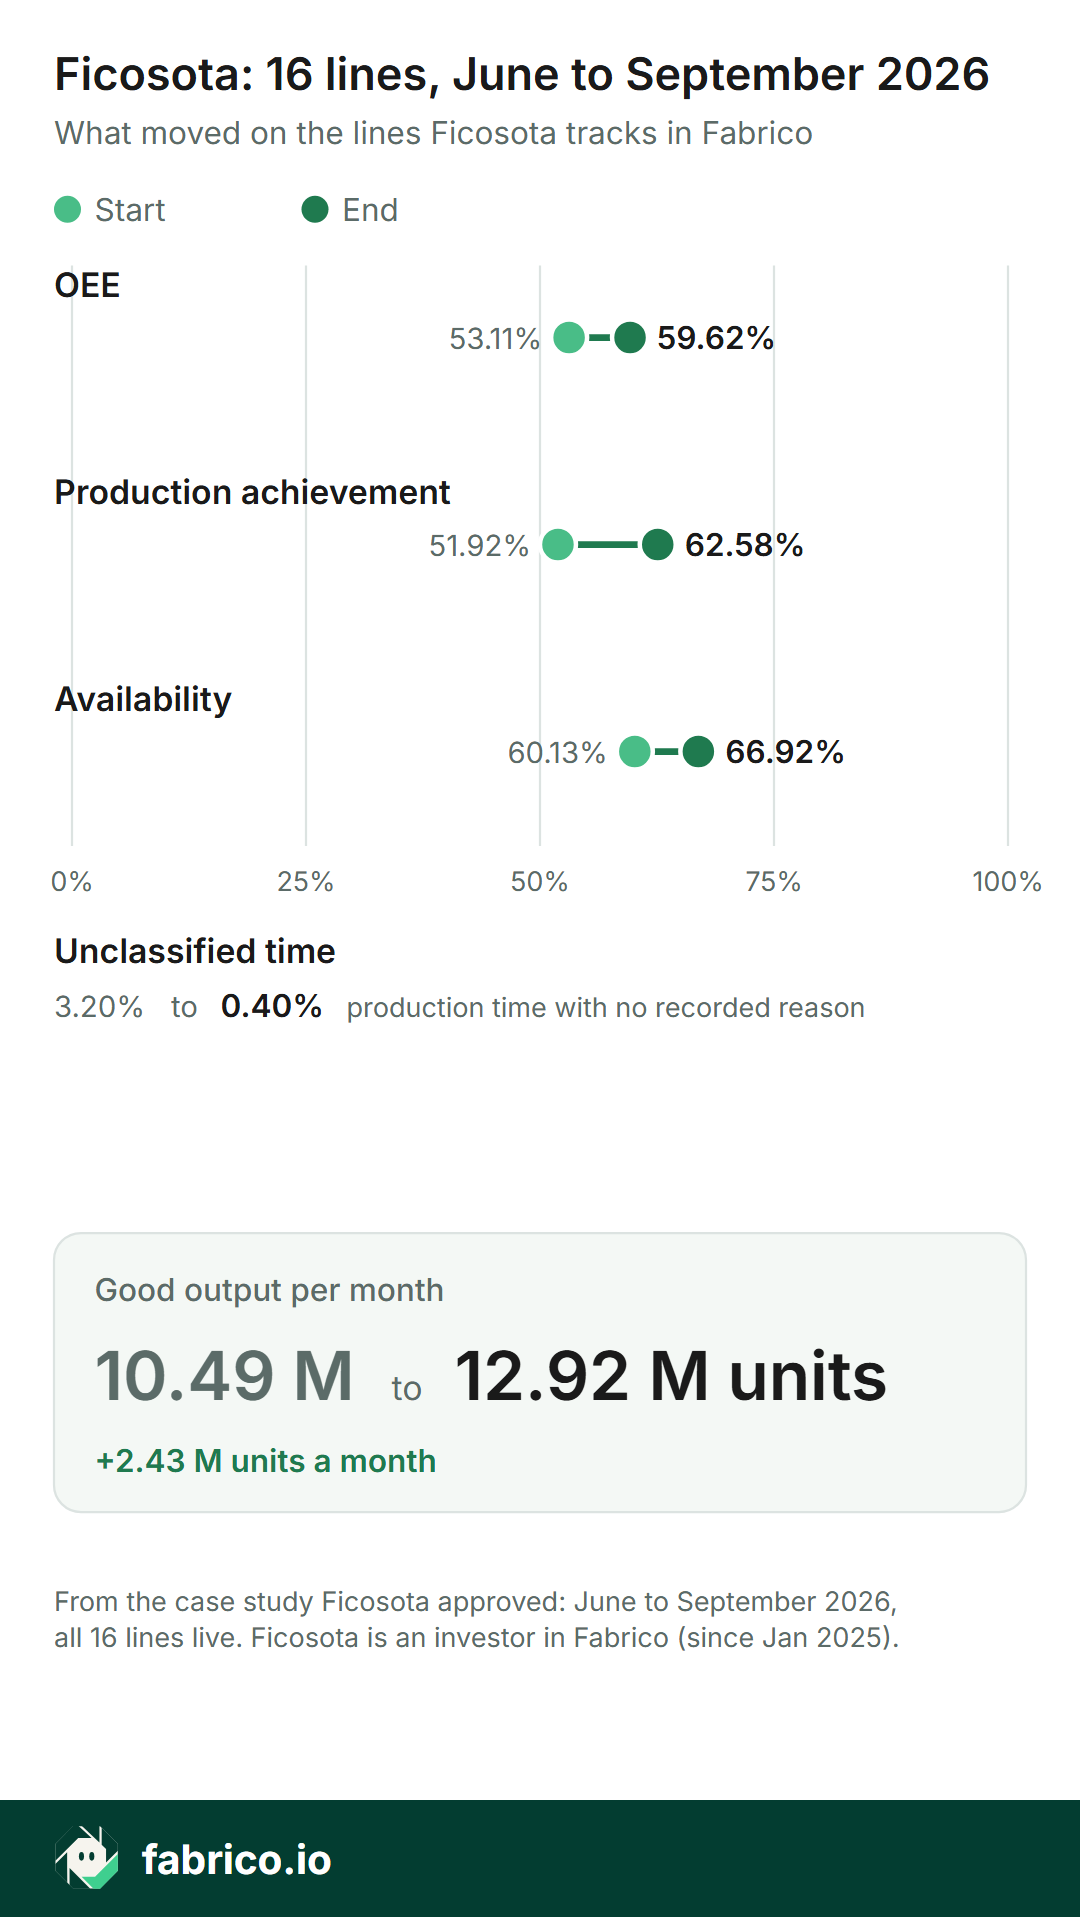
Across 16 lines in Fabrico, Ficosota raised OEE from 53.11% to 59.62% and monthly good output from 10.49 million to 12.92 million units between June and September 2026. Ficosota is an investor in Fabrico; the figures are from the case study Ficosota approved.
- Company: Ficosota, home-care, hygiene and consumer goods. Three factories, exports to more than 70 countries.
- In Fabrico: 16 production lines on OEE with the financial impact module. Maintenance in Fabrico since 2022.
- Period of the results: June to September 2026, all 16 lines live.
- Where the numbers come from: the Ficosota case study, approved by Ficosota.
- Disclosure: Ficosota is an investor in Fabrico (since January 2025) and the industrial partner in the development of the OEE module. Details below.
- Platform: cloud SaaS on AWS; ISO/IEC 27001, ISO/IEC 20000-1 and ISO 9001 certified.
The problem: losses nobody could rank
Before the OEE roll-out, Ficosota had no real-time view of how these 16 production lines were performing. Losses were discussed after the fact, and some were simply accepted as part of a normal day.
The machine park is mixed: different PLC brands, older machines, and lines with no signals at all. Without live data from every line, the biggest losses could not be ranked, so it was hard to know where to act first.
The decision: visibility first, improvement projects second
In a formal tender, Fabrico was selected for its functionality and ease of use. Ficosota started with Fabrico's maintenance module in 2022 and added each module once the previous one had proved its value.
Instead of starting with improvement projects, the team made one decision: make the time on all 16 lines visible, minute by minute. Old and new machines, with or without signals, went into one view. The aim was a category for each minute of planned production time, a reason for each stoppage and a price in money for each loss. By the end of the period, only 0.40% of production time had no recorded reason, down from 3.20%.
When a line, a product or a schedule changed, the platform was updated the same day.
“For a successful software implementation, two things are needed - technology and a good partner. With Fabrico, we had both. The software is intuitive and its easy-to-use interface minimizes the need for training. Data is protected and there are regular updates for better functionality and security.”
Iliya Arbov, Chief Digitalization Director, Ficosota
What the data showed
Two examples of what the data showed.
Waiting for materials. Lines very often stopped while waiting for materials. What used to be an accepted part of the day became a measured, ranked loss, and the team started working on it straight away.
The hidden cost of moving production to another line. A line substitution looked neutral: same people, same hours, the other line running at full speed. With the financial impact module, management now sees the capacity gap between the two lines in money.
The results, June to September 2026
Once all 16 lines were live and the data was trusted, the numbers improved every month, a few points at a time, on the same lines and with the same people.
| Measure | From | To | Change |
|---|---|---|---|
| OEE | 53.11% | 59.62% | +6.51 points |
| Production achievement | 51.92% | 62.58% | +10.66 points |
| Availability | 60.13% | 66.92% | +6.79 points |
| Good output per month | 10.49 million units | 12.92 million units | +2.43 million units |
| Unclassified time | 3.20% | 0.40% | minus 2.80 points |
June to September 2026, all 16 lines live.
What each row means:
- OEE: how much of planned production time became good product at the ideal rate (availability x performance x quality).
- Production achievement: good output against the scheduled target.
- Availability: the share of planned time the lines were actually running.
- Good output: units that left the line as good product, excluding waste and rework.
- Unclassified time: production time with no recorded reason.
Two things to keep in mind when you read the table:
- OEE and good output measure different things. A change in scheduled hours or product mix can move them differently, which is why both are shown with their start and end values.
- Fabrico provides the measurement. The gains came from what Ficosota did with it, on the same lines and with the same people.
“For the first five months, the most important thing is visibility. It gives management a lot of insight - where to push and where to dive deeper, based on the main losses Fabrico finds.”
Kaloyan Georgiev, Chief of Production Automation and Digitalization, Ficosota
Disclosure: Ficosota is an investor in Fabrico
Ficosota has used Fabrico for maintenance since 2022. In January 2025 Ficosota invested in Fabrico's funding round, led by Sofia Angels Ventures, and is the industrial partner in the development of Fabrico's OEE module, with a team of its production engineers. We say this so you can weigh the results with that in mind. The figures and quotes are from the case study Ficosota approved.
Next step: a demo on one of your lines
Bring a recent shift that fell short of plan. On a demonstration line we show how a shift like that looks in Fabrico: the stops and their reasons, the slow running, the waste and, with the financial impact module, what each loss cost.
Then we show how a technician opens a work order from a stop and how the machine's history builds up. Running several plants? Ask to see the group view, where every plant is compared on the same numbers.
See how businesses benefit


Real Fabrico tiles, sample data.