Login
 Blog
Target vs Actual Production Tracking by Hour and Shift

Key takeaways
- Set the hourly target from the ideal rate and the planned production minutes in that hour, not from a round number.
- Track good output against target each hour and keep a running gap for the shift.
- Write the cause next to any hour that misses, while people still remember what happened.
- Convert each gap into minutes at ideal rate, so it can be compared with the logged stops.
- Hours with a break, a changeover or a startup need their own target, or they always look like failures.
It is 11:00 on line 1. The board says 6,000 an hour, the hour from 08:00 made far less, and the comments column is empty. The next hours look fine, the shift ends a few thousand units short, and at the morning meeting nobody can say what happened at 08:15. The OEE figure for the shift is known. The story behind it is gone.
Target versus actual tracking by hour is the simplest way to keep that story. Each hour gets a target, the line writes down what it made, and any gap gets a cause while the crew still remembers it. Done properly, it turns a shift total into a list of specific, fixable losses.
This guide covers how to set the hourly target from the ideal rate and planned time, a template with a worked shift, what to write when a gap appears, how to read the patterns and how to automate the counting.
Why track production by the hour
A shift total hides the shape of the shift. A line can lose 12 minutes in one hour and catch up nothing, or lose two minutes in each of six hours. The total is the same, the fix is completely different.
Tracking by hour does three things. It shows a loss while there is still time to react in the same shift. It forces a cause to be written down close to the event. And over a few weeks, it shows patterns, such as the first hour after startup or the hour after a break, that a daily total never reveals. Our guide to the hour by hour production board covers the board itself.

How to set the hourly target
The hourly target is the ideal rate times the planned production minutes in that hour. Many plants then multiply by a planned OEE, so the target is what a normal hour should reach rather than the theoretical maximum. Pick one rule, write it on the board and keep it.
The ideal rate is the rated speed of the line's constraint, or the best rate the line has shown it can hold for the product, not the average of a good day. Set it per product, because a 1 litre bottle and a 500 ml bottle do not run at the same speed. Our article on ideal cycle time explains how to choose it.
Then adjust the planned minutes hour by hour. A 30 minute break leaves 30 planned minutes. A changeover with a standard time of 20 minutes, if your plant treats the standard as planned, leaves 40. Without this step the break hour always looks red, people learn to ignore red, and the board stops working.
The target vs actual template, with a worked shift
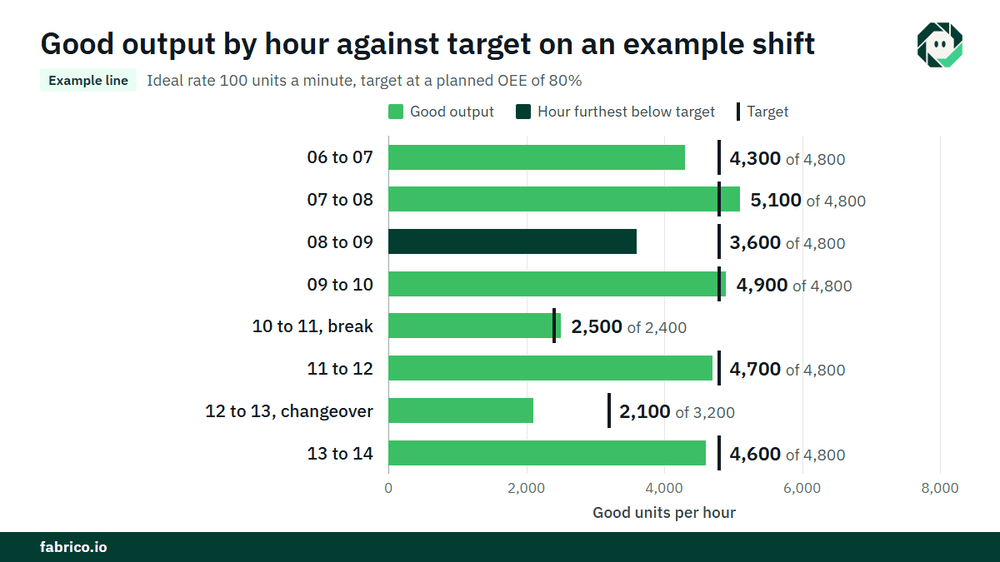
Sample line (illustrative numbers, not a customer): the ideal rate is 100 units a minute and the target uses a planned OEE of 80%, so each planned minute is worth 80 units. The shift runs from 06:00 to 14:00, with a 30 minute break at 10:00 and a changeover at 12:00 with a 20 minute standard.
| Hour | Planned min | Target | Good output | Gap | Running gap | Cause and action |
|---|---|---|---|---|---|---|
| 06 to 07 | 60 | 4,800 | 4,300 | 500 short | 500 short | Slow start after weekend, warm-up |
| 07 to 08 | 60 | 4,800 | 5,100 | 300 ahead | 200 short | |
| 08 to 09 | 60 | 4,800 | 3,600 | 1,200 short | 1,400 short | Filler infeed jam 9 min plus short stops; guide reset, line lead |
| 09 to 10 | 60 | 4,800 | 4,900 | 100 ahead | 1,300 short | |
| 10 to 11 | 30 | 2,400 | 2,500 | 100 ahead | 1,200 short | Break hour |
| 11 to 12 | 60 | 4,800 | 4,700 | 100 short | 1,300 short | |
| 12 to 13 | 40 | 3,200 | 2,100 | 1,100 short | 2,400 short | Changeover 11 min over standard, waiting for first off approval |
| 13 to 14 | 60 | 4,800 | 4,600 | 200 short | 2,600 short | |
| Shift | 430 | 34,400 | 31,800 | 2,600 short | Two causes explain most of the gap |
The arithmetic: 430 planned minutes x 80 = 34,400 units of target. The line made 31,800 good units, so it ended 2,600 short, which is 26 minutes at the ideal rate of 100 a minute. The filler hour and the changeover hour together account for 2,300 of the 2,600.
The shift OEE: 31,800 good units need 318 minutes at ideal rate, and 318 / 430 = 74.0%, against the planned 80%. Priced at $0.30 of contribution a unit, €0.30 in a euro plant, the gap to target is 2,600 x $0.30 = $780 (€780). The full loss against the ideal is larger: 430 x 100 = 43,000 possible units, 11,200 not made, worth 11,200 x $0.30 = $3,360 (€3,360).
What to write when the gap appears
Agree a threshold, for example any hour more than a few minutes short at ideal rate, and require a cause above it. Write it within the hour, not at the end of the shift. Four things are enough: what happened, roughly how many minutes, what was done, and who follows up.
- Good: filler infeed jam, 9 min, guide reset, line lead checks setting at next changeover.
- Not useful: problems at filler.
- Not useful: slow.
Use the same words as the downtime reason list, so the hourly board and the downtime report tell the same story. Write about the machine and the material, never about who was on the line. A board that becomes a place to blame people quickly fills up with nothing.
Reading the gaps: patterns to look for
After a few weeks of hourly data, look across days rather than within one shift. A few patterns show up in many plants:
- The first hour. Warm-up, startup rejects and late material. Often a startup routine problem, not a machine problem.
- The hour after a break. A slow restart, or a break that runs over the planned time.
- Changeover hours. Overruns, ramp-up and approval waits.
- Small gaps with no stops written. When an hour is short but nobody saw a stop, the loss is usually micro stops or slow running.
The last pattern is the one paper boards miss most. Our guides to micro stops and to diagnosing speed loss with data show how to find what sits inside those hours.
From hour to shift to handover
The running gap is the number the shift leader watches. Recovering inside the shift is possible only when the cause is removed early, so the first large gap of the shift deserves the most attention.
At the end of the shift, the board becomes part of the handover: the shift gap, the two or three causes behind it and anything still open, such as a guide setting to check at the next changeover. Our guide to the OEE shift handover covers that step.
Automating target vs actual tracking
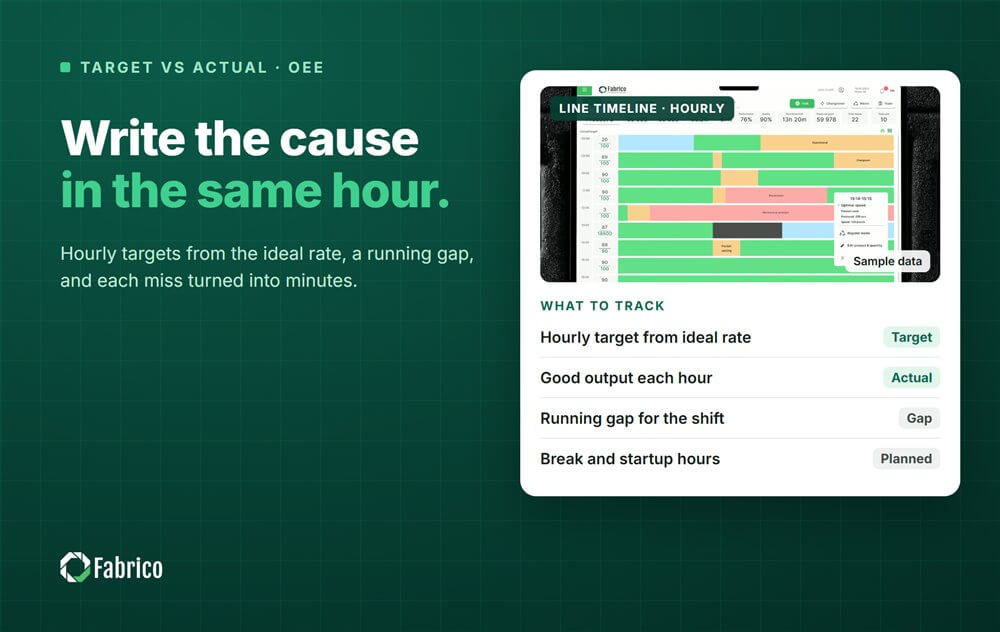
Hand-filled boards depend on someone reading a counter at the right minute, and the comments column is often empty when the line is busy. The numbers can come from the machine instead.
- Good output per hour from the PLC or a counter, minus the reject count.
- Target per hour calculated from the planned minutes, with breaks and changeovers already in the shift plan.
- Stops in each hour logged automatically from the machine signal, with the reason confirmed by the operator at the line.
- A camera clip for a stop, where a camera watches the station, so a short hour can be checked rather than guessed.
The crew still owns the action column. Software fills the numbers; people decide what to do about them.
Mistakes plants make
- One flat target for every hour. Breaks and changeovers then look like failures, and real failures get lost among them.
- A target taken from a good day. It makes slow running invisible.
- Counting total output instead of good output. Rejects then look like production.
- Causes written at the end of the shift. They become guesses.
- Changing the target during the shift. The gap disappears on paper only.
Where Fabrico fits
Fabrico is a computer vision enabled Manufacturing Performance Platform. OEE and light MES come first: OEE live by line and shift shows target against actual as the shift runs, and automatic downtime logging records the stops inside each hour without anyone reading a counter.
The operator confirms the reason in one tap, and where a camera watches the station, a camera clip is kept as evidence for a stop. Losses are priced in money and ranked by money, so the hour that cost most is the one that gets the action. When the cause is a breakdown, a work order goes to the right technician with its cost. Groups get one view across plants, and you can start on one line.
Each plant gets a quote after a review of its lines.
Frequently asked questions
How do you calculate an hourly production target?
Multiply the ideal rate by the planned production minutes in that hour. Many plants then multiply by a planned OEE, so the target reflects a normal hour. Reduce the planned minutes for breaks and planned changeovers.
What is the difference between target and actual production?
The target is what the line should make in a period, set before it starts. Actual is the good output it made. The gap between them, in units and in minutes, is what the team investigates.
How do you track production by the hour?
Use a board or screen at the line with one row per hour: planned minutes, target, good output, gap, running gap and cause. Fill it each hour, from the counter or from machine data.
What should we write when an hour misses target?
What happened, roughly how many minutes, what was done and who follows up, in the same words as the downtime reasons. Write it within the hour.
Should the hourly target include planned OEE?
It can. A target at ideal rate shows the full loss; a target with a planned OEE shows what a normal hour should reach. Choose one rule and keep it so hours and shifts can be compared.
See target vs actual by hour on your line
Bring one shift's hourly board to a demo. We will show the same shift from machine data, with the stops in each hour and their cost.
Latest from our blog