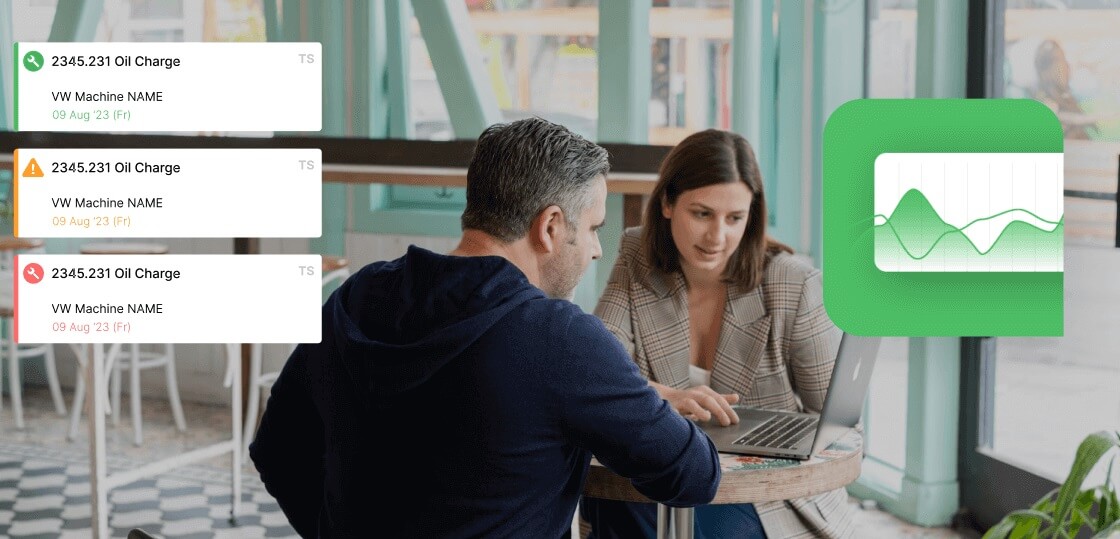
Our CMMS software gives instant access to maintenance reporting data, allowing you to make proactive decisions and meet maintenance requirements.
Our CMMS software gives instant access to maintenance reporting data, allowing you to make proactive decisions and meet maintenance requirements.
Maintenance is an essential aspect, particularly in asset-intensive companies. Neglecting maintenance can result in abrupt equipment breakdowns, ultimately leading to escalated maintenance costs. Timely maintenance is crucial to prevent such issues. The key consideration is determining the frequency of maintenance activities. Summarized reports play a vital role in furnishing valuable insights for scheduling timely maintenance. Fabrico offers concise reports concerning your machinery, assignments, and workforce, enabling prompt identification of areas requiring enhancement and facilitating informed decision-making. All generated reports are readily exportable in a convenient format to your device.

Engage tailor-made visuals to illustrate the top decadal machinery identified as recurrent culprits based on the frequency and overall duration of breakdowns. This CMMS dossier empowers maintenance managers to make informed choices regarding equipment outages and dependability. Given that most machinery seldom encounters sudden downtime, acquiring data directly from failure incidents becomes arduous. Hence, the information utilized to anticipate breakdowns generally stems from the regular operations of a component. During the development of predictive models, algorithms rely on maintenance logs and the history of part replacements to pinpoint instances of failure. Consequently, data inclusive of anomaly detection can also aid in projecting potential breakdowns.

Gain extensive insights from the historical record of equipment, enabling the identification of core issues and the adoption of corresponding measures for issue resolution. Analytics provides visibility into the fundamental cause of the problem. Occasionally, machines operate for extended hours due to excessive reliance on a particular asset; hence, it is imperative to address these factors to avert undue strain. Fabrico meticulously monitors the operational history of the machinery, facilitating the maintenance and repair history documentation. All details related to machine repairs can be conveniently extracted in a user-friendly layout. Reports are instrumental in reducing maintenance costs by providing insights into past maintenance records and identifying areas for cost minimization. This proactive approach enables organizations to plan future maintenance budgets effectively.

Identify areas for improvement, patterns and trends with Fabrico's CMMS analytics software. Enhance your maintenance strategies with actionable data.
Uncover crucial insights into downtime, stoppages, and other vital metrics through the dynamic graphs available in our Analytics section. These visual representations empower you to evaluate essential indicators and fine-tune maintenance operations for optimized performance. Leverage Key Performance Indicators (KPIs) as essential benchmarks to measure progress. These metrics serve as quantifiable yardsticks, providing a clear view of the effectiveness of your CMMS implementation efforts. For instance, if your aim is to trim maintenance costs, pertinent KPIs such as "maintenance cost per unit" or "cost savings achieved through preventive maintenance" are invaluable. These KPIs offer a means to track cost-related advancements and guide informed, data-driven decisions to ensure progress towards your goals.

Analyze your preventive maintenance efforts in comparison with a previous period (month or week) to evaluate the effectiveness and impact of your maintenance management strategies.

Real-time data about scheduled and completed tasks help you gather insight into maintenance activities and performance over time and workforce productivity

We turn maintenance data into comprehensive interactive visuals. All important information is displayed in an easy-to-understand form.
User-friendly graphics, tables and charts give a comprehensive view of your plant. With visual clarity of CMMS data, you can easily interpret metrics and identify trends to streamline maintenance processes.
Fabrico's intuitive dashboards and reports visualise data in real time. Our CMMS software allows maintenance managers to quickly react to changes and adjust maintenance needs in dynamic situations.

Тhe analytics page shows only real time data based on your search criteria.
There are multiple kind of graphs showing downtime statistics and task distribution per type and status.
CMMS reporting enables maintenance teams to make informed decisions based on real-time data, which leads to improved operational efficiency and cost savings.
CMMS reports can help manufacturers streamline work order management, access equipment reliability and track productivity. With proper visualisation of important metrics, manufacturing plant owners can quickly recognize problematic maintenance areas and improve them.
A CMMS plays a crucial role in providing analytics for maintenance activities through detailed reports on maintenance tasks, urgent repairs, downtime due to emergencies, etc.
CMMS compliance refers to using the reporting functionalities of a computerised maintenance management system to adhere to regulatory standards, industry guidelines and legal requirements for maintenance processes. Fabrico's CMMS is IFA- and ISO-compliant.
A CMMS helps in optimising preventive maintenance tasks by providing insights into CMMS KPIs such as mean time between failures and hours spent on maintenance. It also facilitates the development of preventive maintenance plans to minimize downtime.
The CMMS database supports maintenance teams in tracking and managing tasks by centralizing the data and providing information about assets, work orders and maintenance schedules.
Yes, Fabrico offers real-time reporting, so you can get instant access to up-to-date maintenance data and make proactive decisions.
We have a Task costs report that shows the prices of the spare parts used for repairing a machine and the time it took to get it up and running again.
Оur CMMS reporting interface is designed to be user-friendly. A simple initial familiarisation with the software's reporting features will be enough to get used to the data and gain insights from it.
Yes, our dashboards are responsive and they visualise on desktop computers, tablets and smartphones, facilitating on-the-go oversight and decision-making.

Schedule a 1-to-1 meeting with our experts or directly enroll in our Free Plan.
No Credit Card required!