Menu
How to Calculate OEE: A Step-by-Step Guide with a Real-World Example

How to Calculate OEE: A Step-by-Step Guide with a Real-World Example

Key Takeaways

  • The OEE formula is a simple multiplication: OEE = Availability x Performance x Quality.

  • While the math is easy, the real-world challenge is gathering accurate data for each component. Inaccurate manual data is the #1 reason OEE initiatives fail.

  • The goal isn't a single, after-the-fact score. The goal is a real-time understanding of your performance, which is only possible through automated calculation.

How to Calculate OEE: A Step-by-Step Guide with a Real-World Example

The Scenario: Let's Calculate OEE for a Single Shift

Before we dive into the formulas, let's create a real-world scenario. We'll use these numbers for all our calculations to see how they work together.

Imagine a single 8-hour shift for one of your key machines.

  • Shift Length: 8 hours (which is 480 Minutes)

  • Planned Breaks: 60 Minutes (Two 15-min breaks and one 30-min lunch)

  • Unplanned Downtime: 40 Minutes (The machine jammed and had to be cleared)

  • Ideal Cycle Time: 1 Minute per piece (The machine's theoretical top speed)

  • Total Pieces Produced: 300

  • Rejected Pieces: 15

Now, let's turn these raw numbers into a powerful business metric.

Step 1: Calculating Availability – "Are We Running When We Should Be?"

The first piece of the puzzle is Availability. It measures the percentage of time your machine was actually running compared to the time it was supposed to be running.
 

The Formula for Availability


The formula is a simple ratio: Availability = Run Time / Planned Production Time.

First, you need to define those two terms:

  • Planned Production Time is your total shift time minus any scheduled breaks.

  • Run Time is your Planned Production Time minus any unplanned stops (like breakdowns or jams).
     

Let's Calculate It (Our Example)


Let's plug in our numbers:

  • Planned Production Time = 480 mins - 60 mins = 420 Minutes

  • Run Time = 420 mins - 40 mins = 380 Minutes

  • Availability = 380 / 420 = 90.4%
     

The Real-World Challenge: Where Did That "40 Minutes" of Downtime Really Come From?
 

Here's where manual tracking falls apart. That "40 minutes" looks clean in our example, but how was it measured on the factory floor? Did the operator, Tom, start a stopwatch the second the machine stopped? Or was it his best guess, written on a notepad an hour after the fact? Inaccurate downtime tracking is the biggest source of flawed OEE scores.

Step 2: Calculating Performance – "How Fast Are We Running?"

Next is Performance. This component measures how close you are to your machine's top theoretical speed during the time it was running. It accounts for slow cycles and minor, unlogged stops.


The Formula for Performance


The formula is: Performance = (Ideal Cycle Time × Total Count) / Run Time.


Let's Calculate It (Our Example)


Using the numbers from our scenario:

  • (1 Minute/Piece × 300 Pieces) / 380 Minutes = 300 / 380

  • Performance = 78.9%


The Real-World Challenge: What About Minor Stops and Slow Cycles?


The formula is straightforward, but it can be misleading. It doesn't capture the "invisible losses" that kill your performance. A machine running just 5% slower than its ideal cycle time, or the 30-second jams that an operator clears without logging, will devastate your Performance score. Manual data collection almost never captures these crucial details.

Step 3: Calculating Quality – "How Many Good Parts Did We Make?"

Finally, we have Quality. This is the simplest component: it measures the percentage of parts that meet your quality standards.


The Formula for Quality


The formula is: Quality = Good Count / Total Count.


Let's Calculate It (Our Example)


Let's find our Good Count first:

  • Good Count = 300 Total Pieces - 15 Rejected Pieces = 285 Pieces

  • Quality = 285 / 300 = 95%


The Real-World Challenge: Is Your Scrap Data Trustworthy?


When is scrap actually counted? Is it at the end of a busy shift, where a few rejects might be missed? Are operators ever incentivized to under-report scrap to avoid scrutiny? Without a reliable, real-time method for tracking quality at the source, this part of the calculation can often be a rough estimate at best.

The Final OEE Calculation: Putting It All Together

Now that we have our three percentages, we simply multiply them together to get our final OEE score.

OEE = Availability x Performance x Quality

  • OEE = 90.4% x 78.9% x 95% = 67.8%

A score of 67.8% tells you there is significant room for improvement, as a world-class OEE is typically cited as 85% or higher. But this final number is only as trustworthy as the data you put into it.


You Have a Score. Now What? The Problem with Manual Calculations


You did the math and have a number. The problem is, this number is a work of fiction.

  • The Data is Unreliable: As we've shown, every step of the manual process is prone to guesswork and errors. "Garbage in, garbage out."

  • The Calculation is a History Lesson: By the time you've gathered the data and run the numbers in a spreadsheet, you're looking at what happened yesterday or last shift. You can't take real-time action on old news.

  • It Doesn't Trigger a Solution: An OEE score of 67.8% sitting in a spreadsheet doesn't fix a machine. It's a dead end—an autopsy report for a problem that has already cost you money.


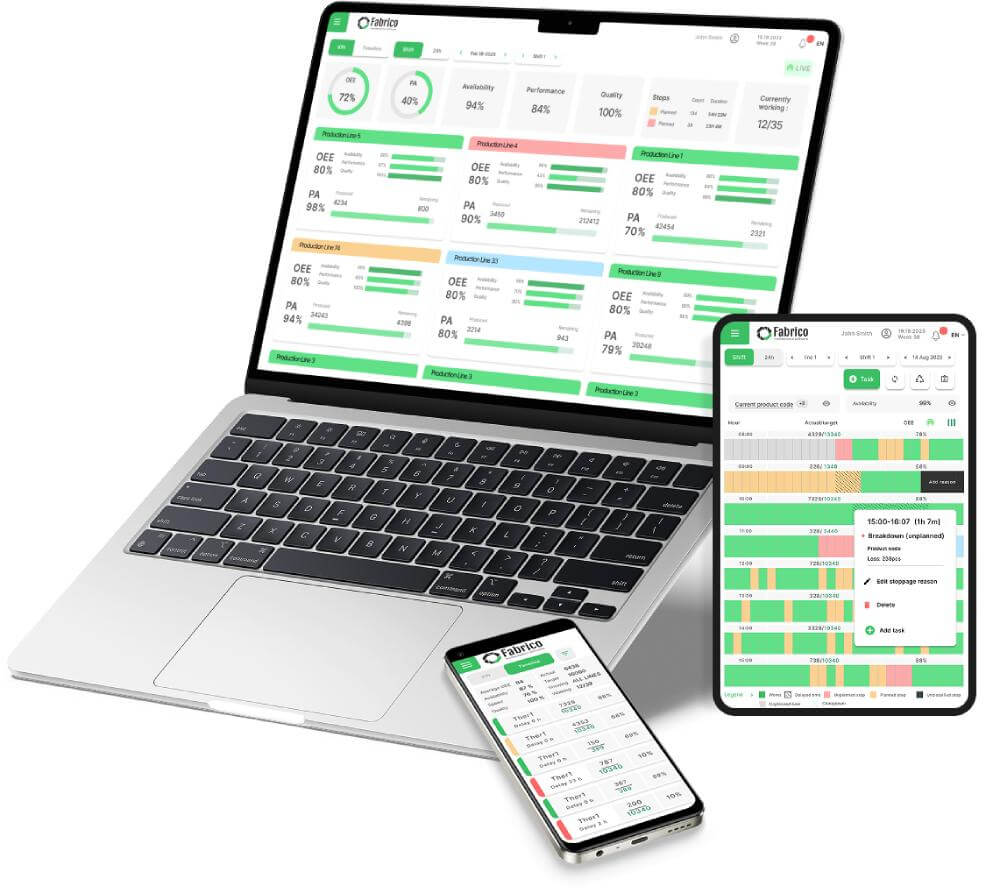
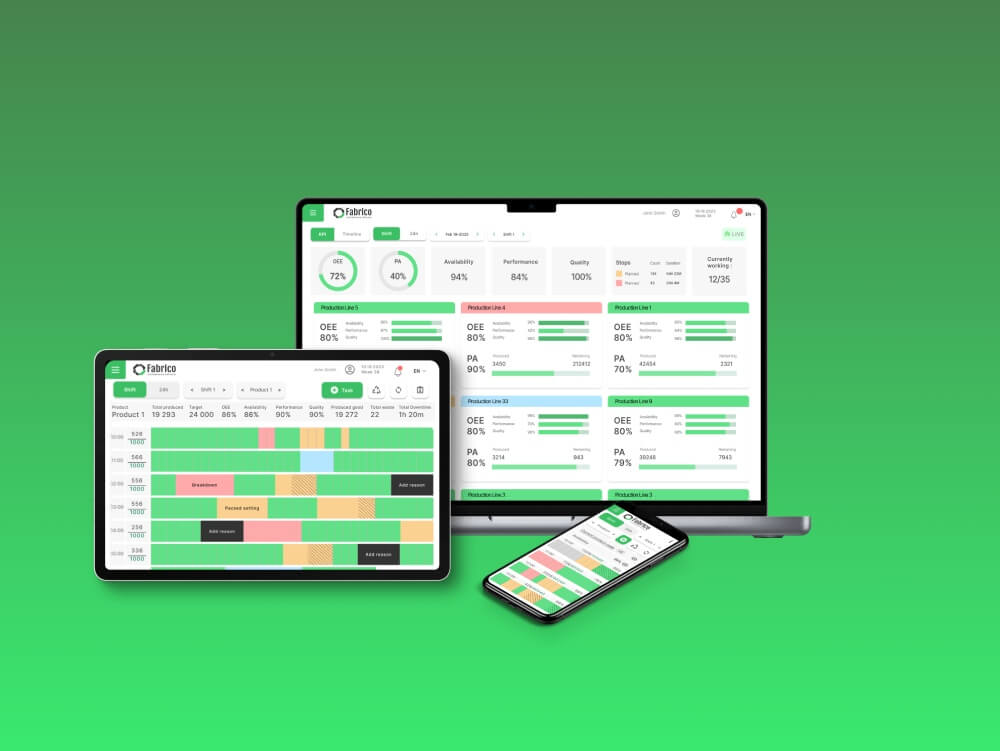
Fabrico: From Manual Calculation to Automated Action


Fabrico automates this entire painful, error-prone process.

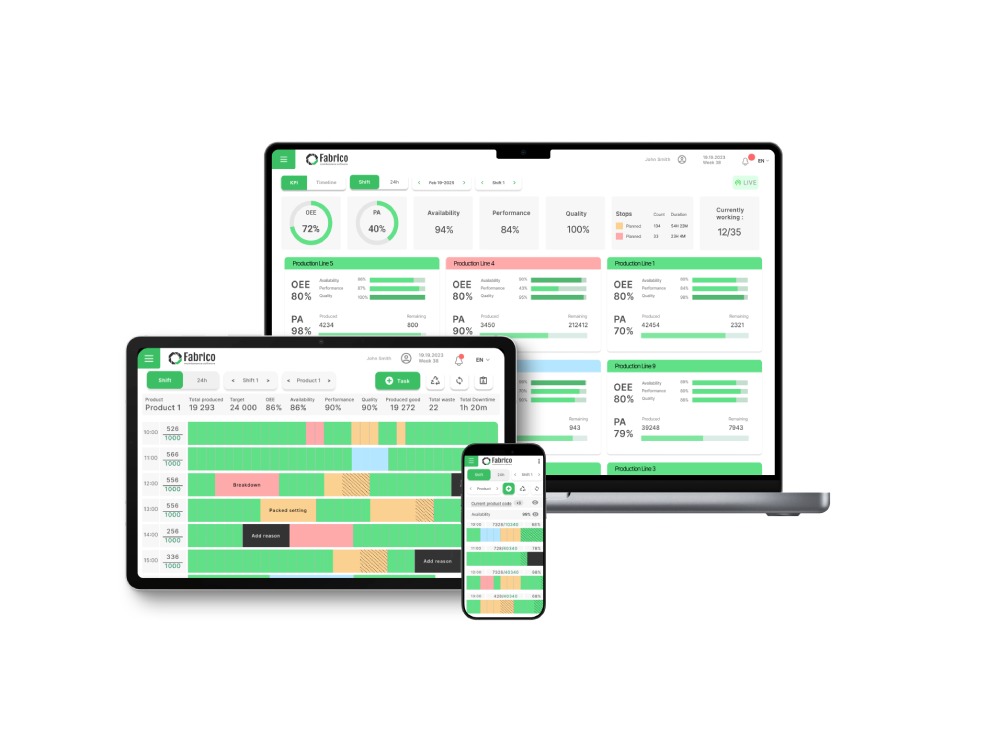
  • Accurate, Automated Data: Fabrico can connect directly to your machines to get real-time, trustworthy data for Availability and Performance, eliminating guesswork.

  • Continuous, Real-Time Calculation: Your OEE score isn't a report you run. It's a live number on a dashboard. You're not looking at the past; you're seeing what's happening right now.

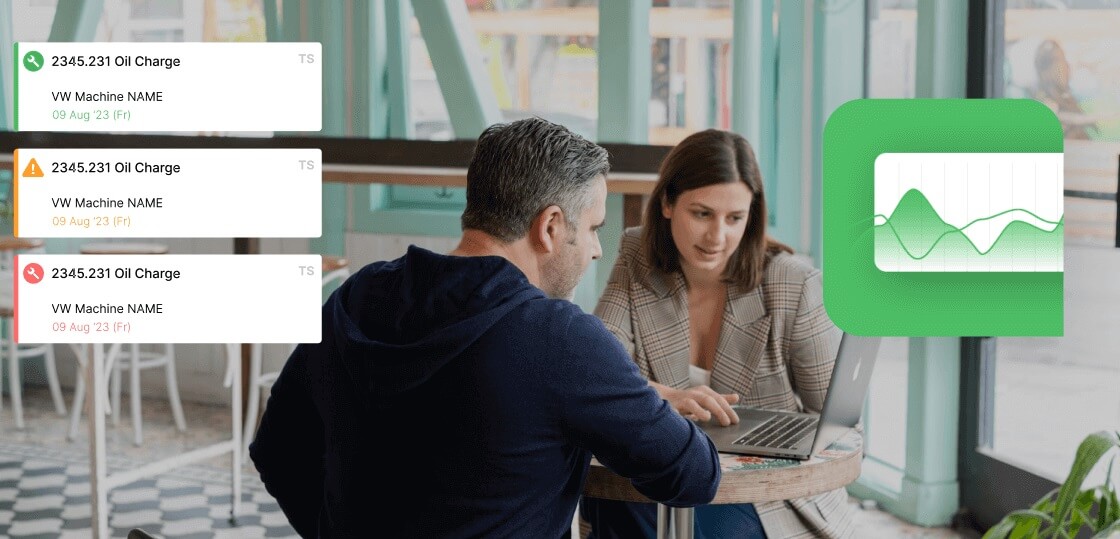
  • The Integrated Cure: This is the game-changer. When OEE drops because a machine goes down, Fabrico doesn't just show you a new number. It automatically triggers a work order in the integrated CMMS, instantly starting the solution.

Take a live tour with a product expert
Schedule a Demo

Frequently Asked Questions (FAQ)

What is the difference between OEE and TEEP?


OEE measures your effectiveness during your planned operating time. TEEP (Total Effective Equipment Performance) measures your effectiveness against the entire calendar (24/7/365). TEEP helps you understand the potential impact of adding more shifts.


Should planned downtime be included in the OEE calculation?


No. Planned downtime (like scheduled breaks or PMs) is excluded from the OEE calculation by first determining the "Planned Production Time." OEE only measures performance during the time you were scheduled to be running.


How often should we calculate OEE?


Manually, most teams can only manage to calculate OEE daily or weekly. However, to be truly effective, OEE should be monitored in real-time. An automated system calculates it continuously, allowing you to react to problems in minutes, not days.

Stop Being a Data Archaeologist. Be an Improvement Leader.

Knowing the OEE formula is just the first step. The real value comes from having a system that does the math for you, accurately and in real-time. This frees you up to spend your valuable time leading improvements, not digging for questionable data.

Ready to see how automated OEE calculation can transform your plant's performance?

Book a personalized demo of Fabrico today.

Latest from our blog

Still Wondering?
Check for Yourself!
Still Wondering?

Schedule a 1-to-1 meeting with our experts or directly enroll in our Free Plan.
No Credit Card required!

By clicking the Accept button, you are giving your consent to the use of cookies when accessing this website and utilizing our services. To learn more about how cookies are used and managed, please refer to our Privacy Policy and Cookies Declaration