
Key Takeaways:
The Concept: Statistical Process Control (SPC) uses math to monitor the manufacturing process. It tells you if your process is "Stable" (Predictable) or "Unstable" (Out of Control).
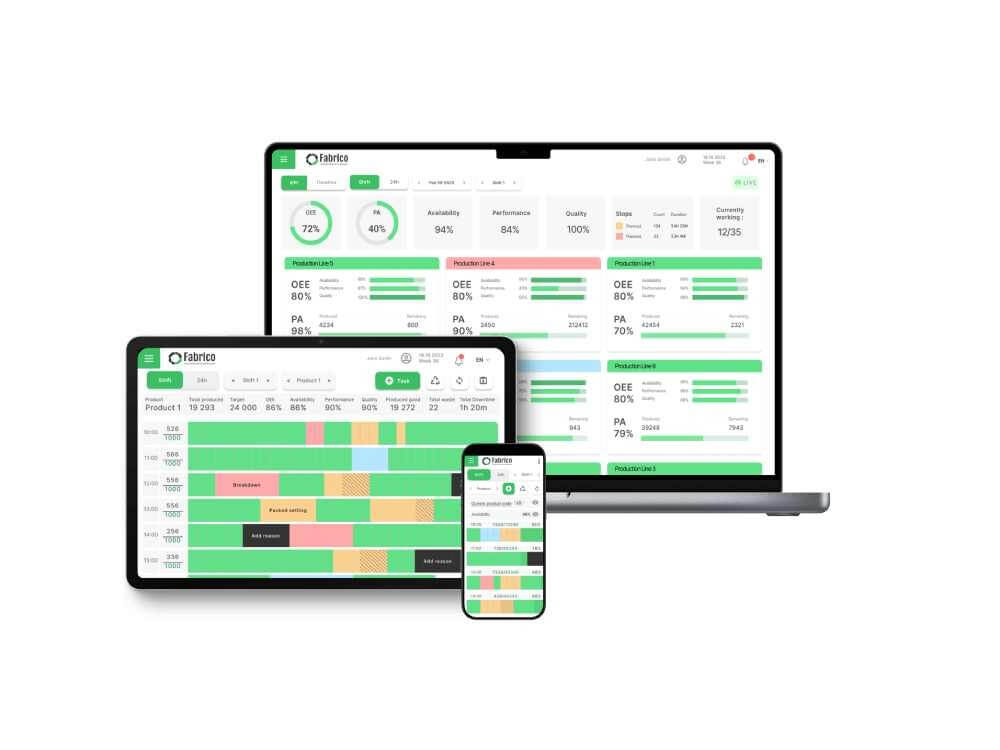
Curious what honest, real-time OEE looks like on your floor?
Watch a 15-min demoThe Goal: To catch defects before they happen by detecting trends (Drift).
The Tool: The Control Chart. It defines the "Upper" and "Lower" limits of normal variation.
The Solution: Paper control charts are useless because they are reactive. Use digital tools to automate data collection and alert you the moment a process drifts.
Inspection is an admission of failure.
If you have a Quality Control (QC) team measuring parts at the end of the line, you are playing a losing game. You have already paid for the material, the energy, and the labor to make the bad part.
The goal of modern manufacturing is to verify the Process, not the Product.
If the process is right (Temperature, Pressure, Speed), the product must be right.
Statistical Process Control (SPC) is the methodology for doing this. It allows you to distinguish between "Normal Noise" (Common Cause Variation) and "Actual Problems" (Special Cause Variation).
Here is the strategic guide to understanding and implementing SPC in 2026.
No two parts are exactly identical. There is always variation.
Common Cause Variation: The natural vibration of the machine. The slight humidity change. This is "Normal."
Special Cause Variation: A tool breaking. A bearing seizing. A bad batch of raw material. This is "Abnormal."
The Goal of SPC:
To tell the operator: "Ignore the Common Cause (don't tweak the machine). React to the Special Cause (fix the machine)."
If an operator tweaks a machine that is behaving normally, they actually increase variation. This is called "Tampering." SPC prevents tampering.
The Control Chart is the heartbeat of SPC. It plots data points (e.g., diameter, weight, temperature) over time.
It has three critical lines:
Center Line (CL): The average.
Upper Control Limit (UCL): The statistical ceiling (usually 3 Sigma).
Lower Control Limit (LCL): The statistical floor.
The Rule:
As long as the dots stay between the UCL and LCL, the process is "In Control." Do nothing.
If a dot goes outside the lines, or 7 dots appear on one side of the average (Trend), the process is "Out of Control." Stop and fix it.
These are the two most confusing acronyms in manufacturing.
Cp (Process Potential): Could we hit the target if we were centered? (Is the car narrow enough to fit in the garage?)
Cpk (Process Capability): Are we actually hitting the target? (Is the car actually parked in the center of the garage?)
The Target:
A Cpk of 1.33 is the standard. It means your process is tight enough that you will almost never produce a defect.
If Cpk < 1.0: You are producing scrap.
If Cpk > 2.0: You are Six Sigma.
In the past, operators plotted dots on a paper chart with a pencil.
The Lag: By the time they connect the dots, they have made 50 bad parts.
The Math: Calculating Control Limits manually is hard. Operators rarely update them.
The Pencil Whip: It is very easy to just draw the dots in the middle to make the boss happy.
In 2026, SPC should be invisible and automated. That means a dedicated SPC platform on the quality side handling the statistical math: control limits, run rules, capability indices. The leading tools here are Minitab, InfinityQS, and ProFicient.
What a dedicated SPC tool does:
Connects to digital calipers, gauges and machine sensors so operators measure instead of type.
Calculates UCL, LCL and Cpk in real time as data streams in.
Flags violations (e.g. "3 points trending up") and forces a reason-code entry from the operator.
Where Fabrico fits
Fabrico is not an SPC tool. We're the OEE and CMMS layer that closes the loop on the equipment-side cause of variation.
When your SPC platform detects drift, tool wear, looseness, vibration creeping above threshold, it can call Fabrico via webhook or API to open a maintenance work order against the specific asset. The technician sees the SPC alert context inside the work order, executes the fix, and signs it off.
The full history lives in the asset record.
The honest pairing:
SPC platform, monitors the process, flags drift, calculates the statistics.
Fabrico, receives the signal, triggers maintenance, captures the fix in the asset history.
If you're already running Minitab, InfinityQS or ProFicient, Fabrico integrates via webhook or REST. If you don't have an SPC tool yet, start there, Fabrico won't replace it.
Inspection looks backward. SPC looks forward.
By using SPC, you stop asking "Is this part good?" and start asking "Is this process healthy?"
Digital SPC tools act as the early warning system for your factory. They detect the "Drift" of a wearing tool or a clogging filter hours before it actually creates a bad part, allowing you to fix it while the line is still green.
See OEE & CMMS live in 15 minutes.
Book a demo


Uzmanlarımızla 1'e 1 görüşme planlayın veya doğrudan Ücretsiz Planımızın bir parçası olun.
Kredi Kartı gerekmez!