


 Login
Downtime Tracking Software for Production LinesSee line stops as they happen. Know what they cost in OEE.
Fabrico logs stops on connected machines from the PLC, an IoT sensor or a camera (add-on).
- Live during the shift
- No end-of-shift logs
- ISO/IEC 27001
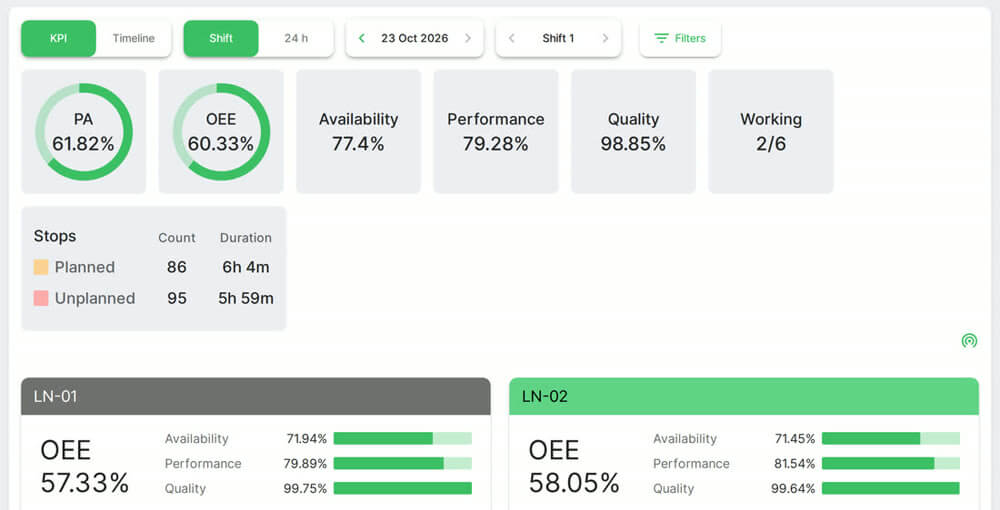 Plant and line OEE. Real Fabrico screen, sample data.
Trusted by manufacturing groups






One shift, hour by hour
Many short stops look nothing like one long breakdown, even when the minutes match.
See machine monitoring
The stop list names each cause
Reason, planned or unplanned, and when it started.

Operators tag the cause at the line
They pick it on a tablet, or scan a machine's QR code to open it.
 Stock photo: an operator at the machine.
Micro-stops and slow cycles stay separate
You can tell a stopped machine from one running below standard speed.
See OEE software
See how it works in a live demo.
Downtime you can’t see is downtime you keep paying for
Most plants know their big breakdowns. The loss hides in the short, frequent stops nobody writes down: a jam cleared in two minutes, a wait for material, a slow restart after a changeover. Each one is small. Together they decide whether a line hits its shift target.
Paper logs miss the short stops
A stop of two or three minutes rarely makes it onto a shift sheet. On a connected machine, the signal counts each one.
Minutes don’t get budget, euros do
A stop list ranked by minutes starts arguments. The same list ranked by lost margin, with the financial impact module, shows which fix pays first.
A reason written at shift end is a guess
When the operator tags the cause at the line, while the stop is still fresh, it becomes a record you can act on.
How downtime tracking works in Fabrico
- 1The machine signal opens a stop record the moment the line stops
- 2The operator tags the cause from your own reason list
- 3Each stop counts against availability, so live OEE by line and shift shows the loss
- 4With the financial impact module, each loss gets a price (lost units times your margin per unit), an owner and an action, and the weeks after show whether the fix held
Where there is no usable machine signal, AI cameras (add-on) count output. For any stop at a camera station, you open the camera video for that minute. In the standard setup it is streamed when you open it, not stored in Fabrico.
Want to see it on one of your lines?
What 40 minutes of small stops a shift can cost one line
One line, three shifts, 220 working days
Sample numbers. 40 minutes a shift on three shifts is 2 hours a day, or 440 hours over 220 days. A line making 12,000 units an hour at €0.20 of margin each loses €2,400 of margin per stopped hour: about €1.06 million a year. Recovering a quarter of it is about €264,000, if you can sell the extra output. If demand is flat, the gain comes back as fewer overtime and weekend hours instead.
Find out what your stops cost.
The questions plants ask before they start
Our operators won’t enter reasons.
They don’t type. They pick the cause from your reason list on a tablet next to the line, or scan the machine’s QR code. Time without a reason is reported as its own figure, so a gap shows up the same shift.
We already have SCADA or an MES.
Fabrico does not control the process or replace SCADA. It reads the machine signals over OPC UA, Modbus, PROFINET or another PLC link, and adds what control screens rarely hold: the operator’s reason, OEE by line and shift and, with the financial impact module, a price and an owner for each loss. Data goes back out through the REST API and webhooks. Job dispatching, BOMs and routings stay in your ERP or MES.
Our machines are old.
Machines without a PLC get an IoT device with external sensors. Manual stations can use an AI camera (add-on) that counts output.
What does it cost, and how soon do we see data?
Fabrico is quoted per plant, from the modules, lines and sites you connect (pricing). You can start with a one-line pilot of under 6 weeks: the line is connected in week 1, with no PLC or IT link needed, and measured in weeks 1 to 3. The pilot fee is credited in full against your first-year subscription if you roll out (how the pilot works).
Time with no recorded reason fell from 3.2% to 0.4%
Ficosota is also an investor in Fabrico (January 2025) and the industrial partner in the development of the OEE module. Fabrico provides the measurement. The gains came from what Ficosota did with it.
See the numbers behind a story like this in a demo.
FAQs
How do you track machine downtime automatically?
Fabrico reads the machine's own run and stop signal instead of handwritten logs. A stop record opens the moment the signal changes, stamps the start time and counts the length until production resumes.
How much does downtime cost per hour?
It depends on the line. Lost margin is the units the line makes in an hour times your margin per unit. For example, with sample numbers, 12,000 units an hour at €0.20 each is €2,400 for every hour stopped. That margin is only lost if you can’t make the output up later, so also count the crew and energy cost while the line waits, or the overtime to catch up. Fabrico’s cost of downtime calculator does the sum with your numbers.
Can Fabrico tell planned from unplanned downtime?
Yes. Each stop is marked planned or unplanned, and planned breaks are taken out of planned production time, so they don’t drag availability down.
What are downtime reason codes?
An agreed list of stop causes, such as a jam, a tool change or a missing operator. A fixed list instead of free-text notes is what lets downtime add up by cause.
How long does it take to start tracking downtime?
With hardware, installing and connecting the devices takes about 1 month, and full rollout takes 3 to 4 months. Reason codes, shifts and dashboards are set up with your team along the way.
More detail
How to calculate availability, with an example
Availability is run time divided by planned production time. An example with made-up numbers: a 480 minute shift with 30 minutes of planned breaks leaves 450 planned minutes. A 25 minute breakdown and a 20 minute wait for material take 45 minutes, so run time is 405 minutes, and 405 divided by 450 is 90%. Availability is then multiplied by performance and quality to give OEE. To put a value on the gap to your target OEE, use the OEE calculator.
Downtime analytics by cause, line and shift
Filter downtime by cause, by line and machine, by shift, or by period, to check a change against the weeks before it. Any list exports to Excel, and the REST API and webhooks connect other systems. Groups with several sites can compare plants side by side, which works best when plants agree on the same reason codes. Maintenance is built in, so a repair is linked to the same machine as the stop.
Find out what your losses cost. Recover the output you already own.
See how losses get a price tag in a live demo.