Menu

Downtime tracking software with automatic stop detection

Machine downtime is logged from the machine itself, not from memory at the end of the shift, so short stops are counted as well as long ones. Fabrico reads the run and stop state from the signal, stamps the start time and counts the duration until production resumes.

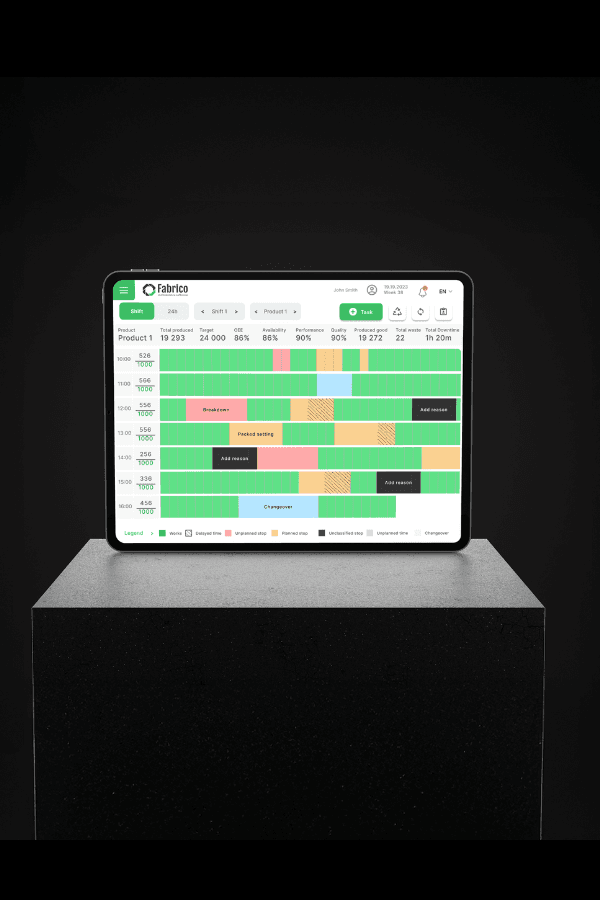
Each machine is set up once in the machine registry, with its files and repair history, and gets a color timeline of run time, stops and micro-stops. On that timeline, a shift full of short stops looks nothing like a shift with one long breakdown, even when the total minutes are the same.

One plant can mix three signal sources, picked per machine and explained on our machine monitoring software page:

  • PLC connection: on automated machines, the signal is read live from the controller.
  • IoT sensor: fitted to an older machine that has no usable PLC output.
  • Camera: on manual or hybrid lines, computer vision watches the line and recognizes when it stands still.
Downtime reason codes

The machine signal tells you that a line stopped. The people at the line know why, so each stop gets its cause from the operator.

In the Fabrico app, the operator picks the cause from a list of reasons agreed with your team, such as material shortage, changeover, waiting for maintenance or breakdown. The start and length of the stop come from the machine signal, so the operator only adds the reason.

Each coded stop carries the machine, line and shift it belongs to. That is what lets the same stop be counted later by cause, by line or by shift.

Fabrico runs on iOS and Android tablets and in the browser. The interface is available in English, Bulgarian, German, French and Polish, and more languages can be added.

An operator who looks after several machines can scan a machine's QR code to open it, instead of searching the plant list.

Real-time downtime dashboards

The same data is on screen while the shift runs. The dashboard shows which machines are running, which are down and for how long, next to the current OEE.

Dashboards are configured for your company, so production and maintenance look at one agreed set of numbers. Where it is used during the day:

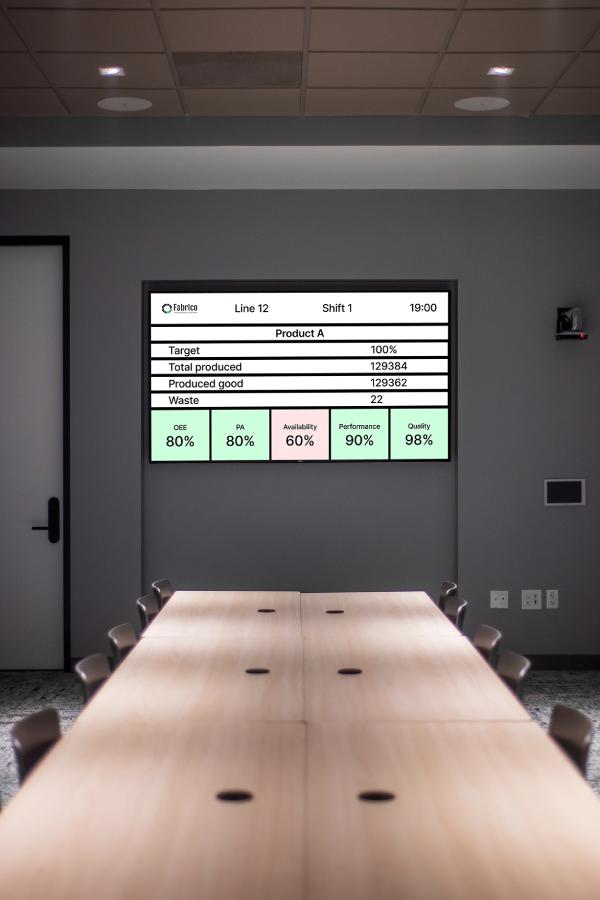
  • On the floor: a TV by the line shows the live state, so the whole team sees a long stop while it is happening.
  • At shift change: the stop list for the last shift shows each stop with its cause and duration, and the next shift sees which machines are still down.
  • In the morning meeting: the meeting-room screen shows yesterday's biggest downtime causes per line, so the discussion starts from the largest loss.
  • Away from the line: a plant manager checks the current OEE of each line in the Fabrico app on a phone.
  • For maintenance: stops coded as breakdown or waiting for maintenance show which lines need a technician.

How downtime lowers OEE availability

Downtime is the availability part of OEE. Availability compares the time a machine actually ran with the time it was planned to run, so every stop counted as downtime lowers it.

Fabrico calculates OEE as Availability × Performance × Quality. Unplanned downtime, such as a breakdown or a wait for material, shows up in the availability factor of that machine and shift.

When availability drops on a line, the stop list for that line and shift shows which causes pulled it down. Downtime and OEE come from one source, so there is no second spreadsheet to reconcile.

Micro-stops and speed loss

Fabrico detects micro-stops from the machine signal and reports them apart from long stops. Slow cycles count as performance loss rather than downtime, so the team can tell a machine that stood still from one that ran below its standard speed.

See our OEE software for the full OEE layer. To put a value on the gap between your current and target OEE, use our OEE calculator.

How to calculate availability, with an example

Availability is run time divided by planned production time. Planned production time is the shift minus planned breaks and any other time the machine was not meant to run. Run time is planned production time minus the downtime inside it.

An example with made-up numbers, for one 8-hour shift:

  • Shift length: 480 minutes.
  • Planned breaks: 30 minutes, so planned production time is 450 minutes.
  • Unplanned stops: a 25 minute breakdown and a 20 minute wait for material, 45 minutes in total.
  • Run time: 450 minus 45, which is 405 minutes.
  • Availability: 405 divided by 450, which is 90%.

Fabrico does this calculation for every machine and shift from the stops it records, and the stop list shows which cause each of those 45 minutes came from. Availability is then multiplied by performance and quality to give OEE.

Downtime analytics by cause

Once stops carry a duration and a reason, you have the data a root cause analysis needs: what stopped, when, for how long and why. Downtime by cause and the top machines by repair count are standard reports, so nobody builds them in a spreadsheet.

A plant can post a decent average OEE while one machine keeps stopping for the same reason. In a weekly review, the team takes the biggest causes on the worst machine, agrees what to change and checks a week later whether those minutes went down.

Group and filter downtime the way you run the plant:

  • By cause: the reasons that cost the most minutes this week, and how they trend.
  • By line and machine: where the hours go, and which machine loses the most.
  • By shift: whether the night shift loses time on the same causes as the day shift.
  • By period: the current shift, last week or a past month, to check a change against the weeks before it.

Open a work order from the stop

The breakdown on the line and the repair that follows are in one system, because maintenance management (CMMS) is part of Fabrico. When a stop needs a repair, a technician opens a work order from it and takes the job on a phone or tablet, wherever they are in the plant.

The emergency flow records the reaction time, and the auto-timer records how long the repair took. Nobody has to retype the breakdown into a separate maintenance tool afterwards.

MTTR and MTBF per machine

Each repair is saved to the machine's repair history. From there Fabrico reports mean time to repair (MTTR) and mean time between failures (MTBF) per machine.

That shows which machines fail most often, which ones take longest to fix, and whether the time went into waiting for the technician or into the repair itself.

Production sees why a line stood still, and maintenance sees what it took to get the machine running again.

Multi-plant comparison

For groups with several sites, a group account shows every plant in one view. Cross-plant comparison reports put plants side by side, so you can benchmark one site against another.

Role-based access control decides who sees one plant and who sees the whole group, and an audit log records who changed what. For group logins, SSO with SAML is available as a custom integration.

The comparison is most useful when plants agree on the same reason codes, so a stop called "waiting for material" means the same thing at every site.

Downtime exports and integrations

Downtime data does not have to stay in Fabrico: any list exports to Excel for your own reporting. Fabrico also connects to other systems through the REST API and webhooks, and maintenance work syncs both ways with SAP PM.

When you start, your machine list can be imported in bulk from Excel instead of being typed in by hand.

FAQs

What is downtime tracking software?

Downtime tracking software records machine and equipment downtime: when each stop starts, how long it lasts and why it happened. Fabrico captures each stop in real time and totals downtime by cause, so the biggest losses show first.

How do you track machine downtime automatically?

Automatic downtime tracking reads the machine's own run and stop signal instead of handwritten logs. Fabrico opens a stop record the moment the signal changes, before anyone has to explain it.

Does downtime tracking capture micro-stops and slow cycles?

Yes, Fabrico picks up stops of a few seconds from the same machine signal as long ones and lists them as micro-stops. Cycles that run below standard speed are counted in the performance factor of OEE.

How does downtime tracking connect to maintenance?

Fabrico includes maintenance management (CMMS), so downtime and repairs are tracked on the same machines. The work order is opened by a technician from the stop itself, and the repair time counts toward that machine's MTTR and MTBF.

How long does it take to start tracking downtime with Fabrico?

With hardware, installing and connecting the devices takes about 1 month, and full rollout takes 3 to 4 months. Reason codes, shifts and dashboards are set up with your team along the way.

What are downtime reason codes?

Downtime reason codes are an agreed list of stop causes, such as a jam, a tool change or a missing operator, that operators pick from when a machine stops. A fixed list instead of free-text notes is what lets downtime add up by cause.

Define Your Reliability Roadmap
Validate Your Potential ROI: Book a Live Demo
Define Your Reliability Roadmap
By clicking the Accept button, you are giving your consent to the use of cookies when accessing this website and utilizing our services. To learn more about how cookies are used and managed, please refer to our Privacy Policy and Cookies Declaration