Login
Login
Real-time OEE monitoring by line and shift
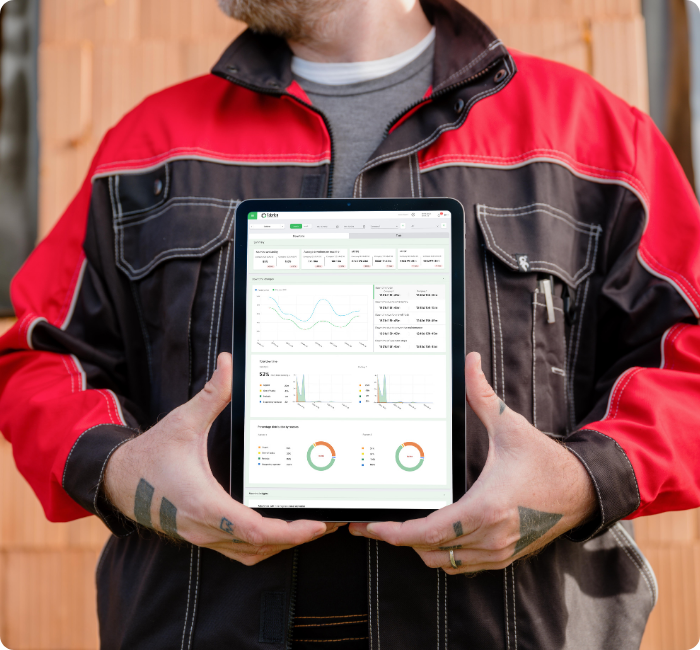
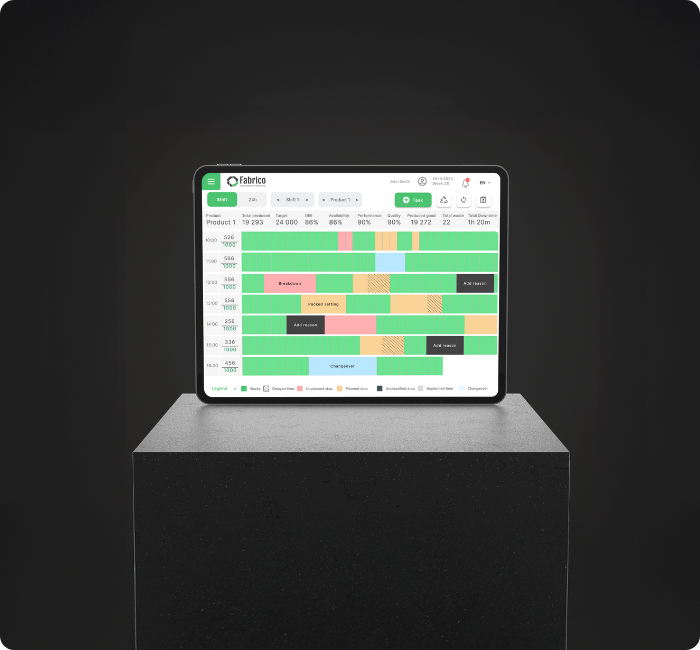
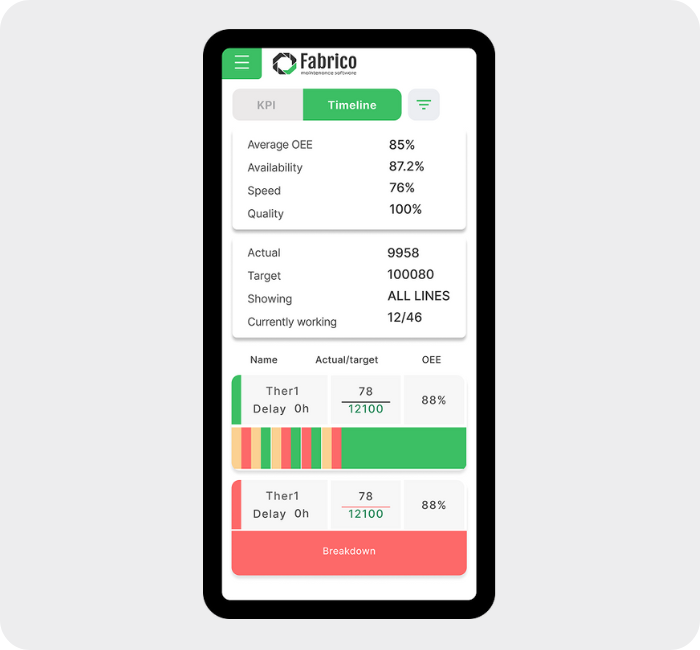
The OEE dashboard updates while the line runs. Each machine shows its overall equipment effectiveness split into availability, performance and quality, so you can see which of the three is pulling the score down.
- Availability: run time against planned production time, the shift with breaks and non-production time taken out.
- Performance: actual output against what the ideal cycle time allows in the run time, so slow cycles and micro-stops show up.
- Quality: good units against all units produced.
- OEE tracking: each machine over the current shift or a past period, so you can see when a drop began.
OEE is never higher than its weakest factor. When availability holds up but performance drops, the shift lead checks cycle speed before calling maintenance.
For a first estimate before a demo, the OEE calculator prices the gap between your current OEE and your target.