TL;DR
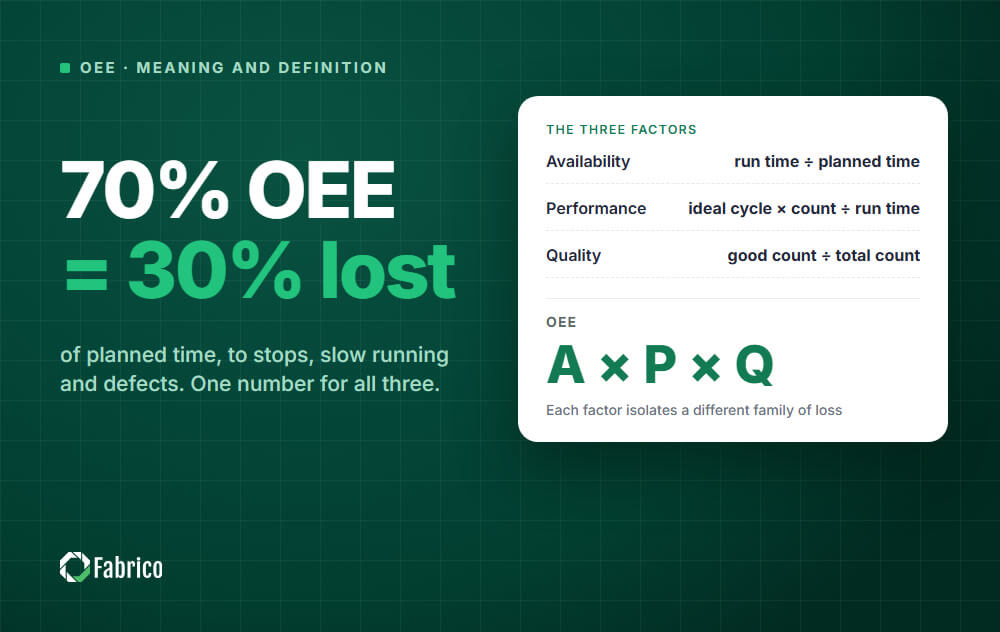
Overall Equipment Effectiveness (OEE) is a single percentage score that measures how productive a manufacturing line truly is, calculated as Availability × Performance × Quality. World-class is 85%, manufacturing average is 60%. OEE matters because it consolidates downtime, slow cycles, and defects into one number you can act on.
Calculating your Overall Equipment Effectiveness is an objective way to uncover the hidden factory capacity leaking from your production lines. The tables and events that number is computed from, including the shift calendar that decides the denominator, are in our OEE data model.
Most manufacturers fall into the scoreboard trap by buying passive software that reports a low score but cannot dispatch a technician to fix it.
True operational excellence requires a system that connects directly to your machine network to capture exact performance data in real time.
Unifying your production data with a mobile maintenance execution platform transforms passive metrics into immediate factory floor action.
Utilizing computer vision to capture video evidence of micro stops is now a mandatory requirement for accurate root cause analysis.
OEE formula: Availability × Performance × Quality = OEE percent
For benchmark data, how 250 European plants score. For the capture layer, data collection methods and the no-PLC vision approach.
If your factory is tracking production losses using end of shift spreadsheets, your data is already obsolete. Manual calculations rely on human memory and introduce massive process variance. You cannot engineer equipment reliability if your baseline metrics are built on guesswork.
The software market is heavily divided. One side sells passive dashboards that only report production numbers. The other side sells generic maintenance apps that operate completely blind to machine cycle times.
This guide defines the ultimate manufacturing metric. It will also show you exactly why top tier operations are abandoning standalone dashboards for one platform that turns data into action.
If you are choosing a tool rather than learning the metric, our OEE software page shows how Fabrico, an MES and OEE platform, tracks OEE by line and shift with data captured straight from your machines, and sorts downtime into planned stops, unplanned stops and micro stops.
Overall Equipment Effectiveness (OEE) is the gold standard manufacturing metric used to measure the percentage of planned production time that is truly productive. An OEE score of 100 percent means you are manufacturing only good parts, as fast as possible, with zero stop time.
OEE stands for overall equipment effectiveness. It means: how much of the time a machine was scheduled to run was spent making good parts at full speed.
| Word | Meaning in OEE |
|---|---|
| Overall | It combines all three loss types in one number |
| Equipment | It is measured on a machine, a line or a work cell |
| Effectiveness | It measures how much good output the equipment delivered against what it could have delivered |
You will sometimes see it written as overall equipment efficiency. The accepted term is effectiveness, because OEE counts stops and defects as well as speed.
OEE (overall equipment effectiveness) is a manufacturing metric that shows how effectively a machine or line uses the time it was scheduled to produce.
It combines three kinds of loss into one percentage: stops, slow running and defects.
An OEE of 70% means that 70% of planned production time was fully productive. The other 30% was lost somewhere.
Imagine a machine is scheduled to produce for one hour. OEE asks three simple questions about that hour. To turn the metric into a program, see the 90-day OEE improvement program for plant managers.
Multiply the three answers and you get OEE.
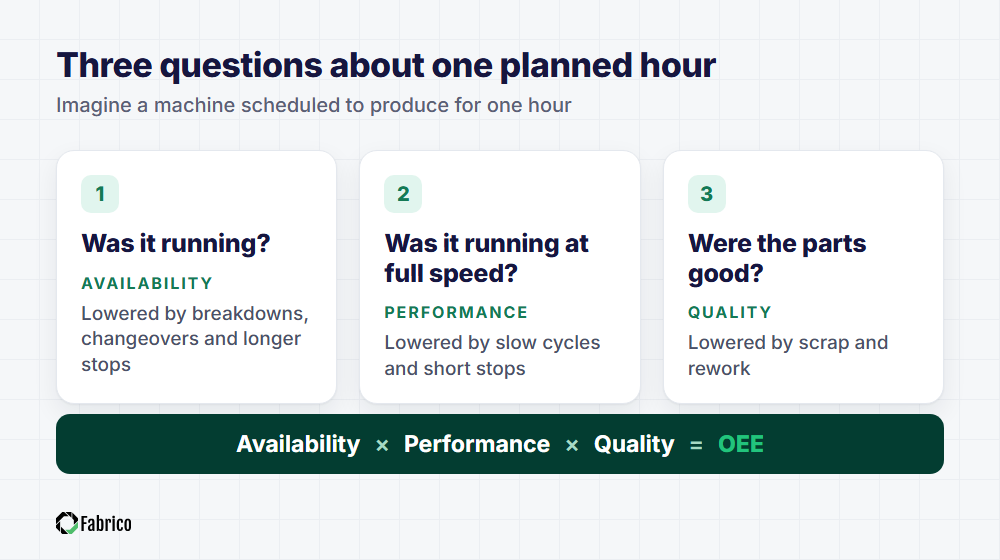
Answering those three questions by hand means calculating OEE after the shift. OEE software such as Fabrico, a cloud-based MES and OEE platform, answers them from machine data while the shift is still running, recording each stop and its duration and showing OEE by line and shift.
Overall equipment effectiveness (OEE) measures how much of the time a machine was scheduled to run actually produced good output at its ideal speed.
To calculate your score, you must measure three distinct variables. You multiply Availability by Performance and then by Quality.
1. Availability
Availability measures your total unplanned and planned stop time. It is calculated by dividing your actual operating time by your planned production time. If a machine breaks down for an hour during a scheduled shift, your availability score drops.
2. Performance
Performance measures how fast your machines are running compared to their maximum designed speed. It is calculated by dividing your ideal cycle time by your actual cycle time. Micro stops and slow running equipment will destroy your performance metric.
3. Quality
Quality measures the number of defect free products you manufacture. It is calculated by dividing your good count by your total count. Parts that require rework or end up as scrap directly reduce your quality score.
OEE is a machine and process metric, not a score for people.
OEE is often confused with other metrics. Here is how to tell them apart.
| Metric | How it differs from OEE |
|---|---|
| Efficiency | Usually compares output with a standard rate, without counting stops or defects |
| Utilization | Shows how much of the available time was used, not how well it was used |
| Productivity | Compares output with an input such as labor hours or cost |
| Uptime | Covers stops only, like availability, but ignores speed and quality |
OEE is also not a people metric. Using it to rate operators tends to produce better-looking numbers, not better machines.
For a deeper comparison, read production efficiency and OEE vs utilization.
| Term | Meaning |
|---|---|
| Planned production time | The time a machine is scheduled to produce, after breaks and other time with no production planned are removed |
| Run time | Planned production time minus breakdowns, changeovers and other longer stops |
| Ideal cycle time | The fastest time the machine can make one part under optimal conditions |
| Availability | Run time ÷ planned production time |
| Performance | Actual output compared with output at the ideal cycle time |
| Quality | Good parts ÷ total parts |
| Micro stop | A very short stop, usually counted as a performance loss |
| Six big losses | Failures, setups, minor stops, reduced speed, startup rejects, production rejects |
| TEEP | OEE measured against all calendar time instead of planned time |
OEE comes from Total Productive Maintenance (TPM), the improvement system associated with Seiichi Nakajima and the Japan Institute of Plant Maintenance.
In TPM, OEE is the measure of how well equipment is used, and the six big losses explain where the rest of the time goes.
OEE is also one of the manufacturing operations KPIs described in the international standard ISO 22400.
For a maintenance team, OEE shows how much equipment problems cost the production schedule.
That is why OEE and reliability metrics such as MTBF and MTTR work best side by side.
OEE shows the size of the loss. MTBF and MTTR show whether the problem is how often machines fail or how long repairs take.
OEE monitoring means measuring OEE continuously, usually from machine data, instead of calculating it by hand after the shift.
Data can come from the machine's PLC, from retrofit sensors or from cameras. The team can then react during the shift, while the loss is still happening.
Our guide to OEE monitoring explains how it works.
Many factory leaders invest heavily in standalone tracking software. They install sensors and mount large television screens across the shop floor. They achieve perfect visibility of their Six Big Losses.
Unfortunately, visibility does not equal capability.
A dashboard cannot fix a broken conveyor belt. When a machine faults and the availability metric turns red, the operator still has to manually request a repair. They must find a supervisor, log a paper ticket, and wait for a technician to arrive.
This decision latency artificially inflates your Mean Time To Repair. Your highly advanced tracking software is simply staring at the problem while you lose money.
To reclaim your hidden factory capacity, you must bridge the gap between production intelligence and maintenance execution. Fabrico provides the exact architecture needed to connect the two.
Instead of relying on manual data entry, Fabrico connects directly to your existing machine controllers and legacy gateway devices. It calculates your metrics in real time with absolute precision.
When your equipment experiences a drop in performance, Fabrico logs it instantly. A technician opens a condition directed work order from that record, and notifications set by event and role alert the right technician via a native mobile application.
Generic maintenance software forces you to schedule preventive tasks based on a rigid calendar. This wastes money on healthy spare parts and risks catastrophic failures on overworked machines.
Direct machine integration changes this paradigm completely. Because Fabrico reads the actual machine data, it counts exact production cycles.
If a stamping press requires lubrication after ten thousand cycles, the system tracks that metric effortlessly. It automatically generates the digital cleaning checklist precisely when the machine hits its limit.
This usage based approach guarantees peak equipment reliability without wasting your maintenance budget.
Sometimes a machine records a micro stop but cannot identify the root cause because the issue was entirely manual. A jammed feeder or an operator delay will ruin your performance score but leave no mechanical error code.
Fabrico solves this operational blind spot with computer vision. Overhead cameras detect manual inefficiencies that traditional sensors miss.
The system captures video clips of the exact downtime event. This allows your continuous improvement team to perform visual root cause analysis perfectly synchronized with your production data.
The future of industrial maintenance is highly automated. Please note that our artificial intelligence agent for schedule optimization and our generative troubleshooting assistant are currently in beta.
These tools are on our immediate development roadmap and will soon autonomously translate complex machine data into actionable repair strategies.
| Strategy | Spreadsheets | Standalone Dashboards | One Platform for Data and Action (Fabrico) |
| Data Collection | Manual and Delayed | Automated Sensors | Direct Machine Connection |
| Maintenance Trigger | Paper Work Orders | Manual API Routing | Work Orders Opened from Logged Stops |
| Root Cause Analysis | Guesswork | Sensor Data Only | Computer Vision Video Replay |
| Execution Tool | Clipboards | Disconnected Apps | Mobile First with Asset Scanning |
| Production Scheduling | Blind | Blind | On the Roadmap |
Calculating your manufacturing metrics is a financial necessity. However, simply reporting on your losses does not inherently fix them.
Treating your production data as a separate entity from your maintenance department is a massive strategic failure. To maximize your factory output, you must turn machine signals into immediate action.
By unifying your machine network with a mobile maintenance execution platform, you empower your technicians to act instantly. You stop reporting on failures and start engineering true operational resilience.
The first question every plant manager asks: what should our OEE be?
The answer depends on industry, line type, and where you start. Use these reference points, not as targets, but as a sense of where you sit.
| OEE band | What it means | Typical setting |
| 40-60% | The honest starting point for most plants on first measurement. Lots of hidden downtime, no formal tracking. | Older lines, mixed fleets, no automation |
| 60-75% | Average for European discrete manufacturing. Some PM in place, basic loss tracking. | Most mid-size plants |
| 75-85% | Strong. Active loss reduction program, integrated CMMS, daily KPI review. | Top quartile in industry |
| 85%+ | World class. Continuous improvement culture, near-zero unplanned downtime, tight cycle control. | Top 5% in the world |
The trap: chasing the 85% number from day one. It distracts from the real win, which is finding the 5-10 points of OEE your line is leaving on the floor every shift. A plant that moves from 55% to 68% has unlocked more capacity than one that moves from 80% to 83%.
Industry context matters too. Pharma packaging lines often run at 85-90% because cycle time is tightly controlled.
Heavy automotive presses sit at 55-65% because changeover loss is structural. Food and beverage falls in the middle, hit hard by washdown and product changeover.
Pick the right benchmark for your industry, not the global average.
OEE measures the gap. The Six Big Losses tell you where the gap is.
Every shift, your line is losing time to these six categories. Knowing which one is biggest tells you where to start.
1. Equipment failure. Unplanned breakdowns.
A bearing seizes, a motor burns out, a sensor fails. Highest visibility, easiest to count, often the loudest in the room. But rarely the biggest loss in disguise.
2. Setup and adjustments. Changeover from one product to another.
Tool changes. Recipe changes.
Cleaning between food allergens. This is structural loss for any plant running mixed products on one line.
3. Idling and minor stops. Stops under 5 minutes.
A jam clears in 30 seconds. An operator pauses to swap a roll.
These never show up on a manual log because nobody writes down a 30-second event. They are the silent killer of OEE.
4. Reduced speed. The line runs but at less than design rate.
Worn parts, miscalibration, operator over-caution after a recent failure, conservative recipes. The cycle-time creep that nobody notices until the OEE report flags it.
5. Process defects. Out-of-spec product made during steady-state running.
Root cause is usually drift in the process, not a one-off.
6. Reduced yield. Startup waste and changeover waste.
The first 20 units after restart that go to scrap. The line learns the recipe again every shift.
Where to start: measure all six for one full week on your worst-performing line. The biggest category gets first attention. For most European plants, idling and minor stops or changeover are the surprise winners, not equipment failure.
OEE projects fail when they start with a tool selection meeting and end six months later with nothing on the floor. Reverse the order.
The plants that move OEE fastest are not the ones with the most expensive software. They are the ones that start measuring before they buy anything.
If your line is high-speed and operator logs cannot capture micro-stops, that is when Computer Vision pays back. Until you have the manual baseline, you cannot tell.
Overall Equipment Effectiveness is one number for how much good product a machine made compared with how much it could have made in the time it was scheduled to run. It combines availability, performance and quality into a single percentage.
Multiply the three factors: Availability (run time divided by planned production time), Performance (ideal cycle time times total count, divided by run time) and Quality (good count divided by total count). Each factor isolates a different family of loss.
Around 85 percent is the figure usually quoted as world class for discrete automated manufacturing, and many real plants run in the 40 to 60 percent range. Comparing your trend against your own baseline is more useful than chasing someone else's benchmark, because the number depends heavily on how you define planned time.
Usually because short stops and small speed losses are being counted for the first time. That is the system working correctly.
A number that drops when you start measuring honestly is more useful than a flattering one. See micro stops.
It fits best where a line has a definable ideal rate and quality standard. On highly manual or highly variable processes the score still moves, but the underlying loss categories matter more than the headline percentage.
Turn downtime into a number your team can actually act on.
Request a demoContact us












 Login
Login
 Blog
Blog