


 Login
Manufacturing Analytics and ReportingSee where the shift lost its time.
OEE and top stoppages by hour, shift, day, week or month, from the same machine data.
- Live from your machines
- Export to Excel
- Web, iOS and Android
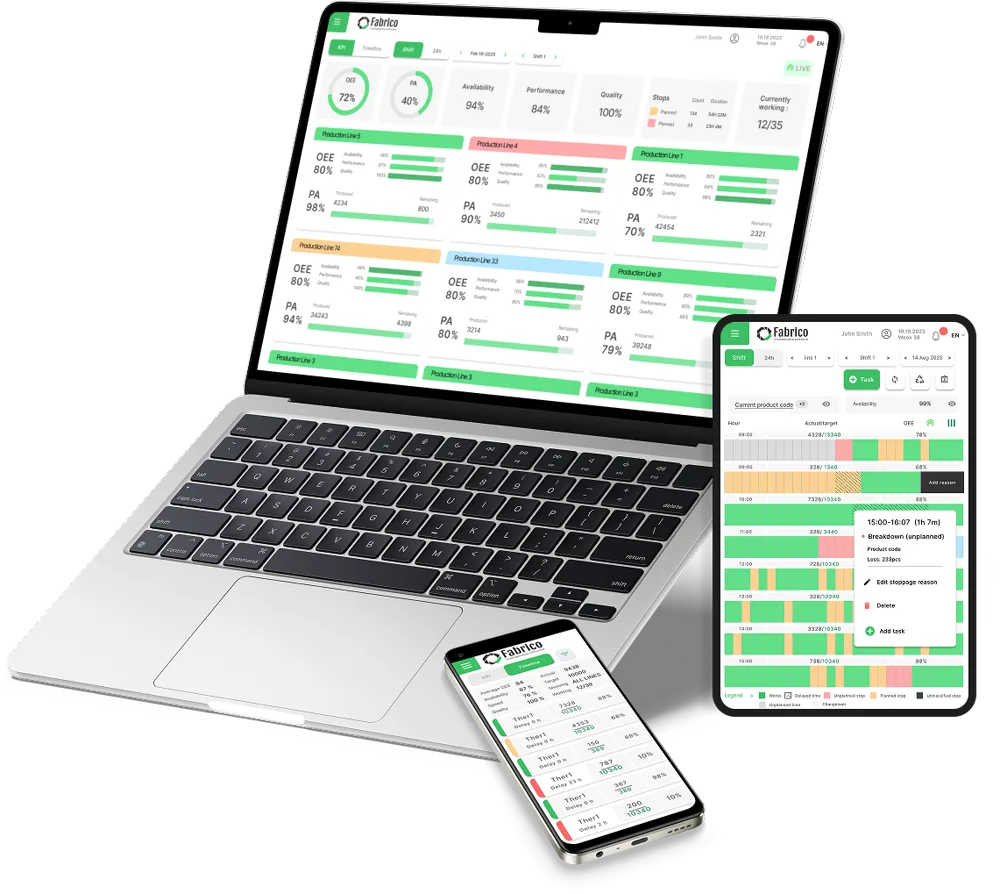 Product render, sample data
Trusted by FMCG, food and industrial manufacturing groups







OEE by line and shift
Availability, performance and quality side by side, so you see which one pulls the score down.
Top stoppages and downtime distribution
Stops with their reason, type and duration, ready to export.

Output against target, hour by hour
Catch the drop while the shift can still recover it.

Spot the worst offenders
The machines with the most downtime in the period you pick.
 Fabrico chart, sample data
See your own losses in a live demo.
OEE from 20% to 62% in three months
FAQs
Do the analytics dashboards show real-time data?
Yes. The dashboards show real-time data based on your search criteria.
What can I report on?
OEE, production achievement, TEEP and equipment utilization, top stoppages and downtime distribution, by hour, shift, day, week or month, with exports.
Can I open the dashboards on a phone?
Yes. Dashboards work on desktop computers, tablets and smartphones.
Is training required?
The reporting interface is designed to be easy to use, and a short introduction is enough to get started. Training is live and on site during rollout.
More detail
Maintenance reports on the same machine record
Fabrico also includes maintenance reporting: MTTR, MTBF, downtime and task costs. The task costs report shows the spare parts used for a repair and the time it took to get the machine running again.
Repair history and task completion sit on the same machine record, so you can compare preventive maintenance against a previous week or month. See the Fabrico CMMS.
Where the data comes from
Figures come from PLCs, IoT sensors or cameras, or manual mode on lines without sensors, plus the reasons operators tag. See our machine monitoring software and downtime tracking software. For the whole MES and OEE platform, start from the solution overview.
Find out what your losses cost. Recover the output you already own.
See your own losses with a price tag in a live demo.