"What gets measured gets managed." — Peter Drucker.
"What gets measured manually gets manipulated." — Modern Manufacturing Reality.
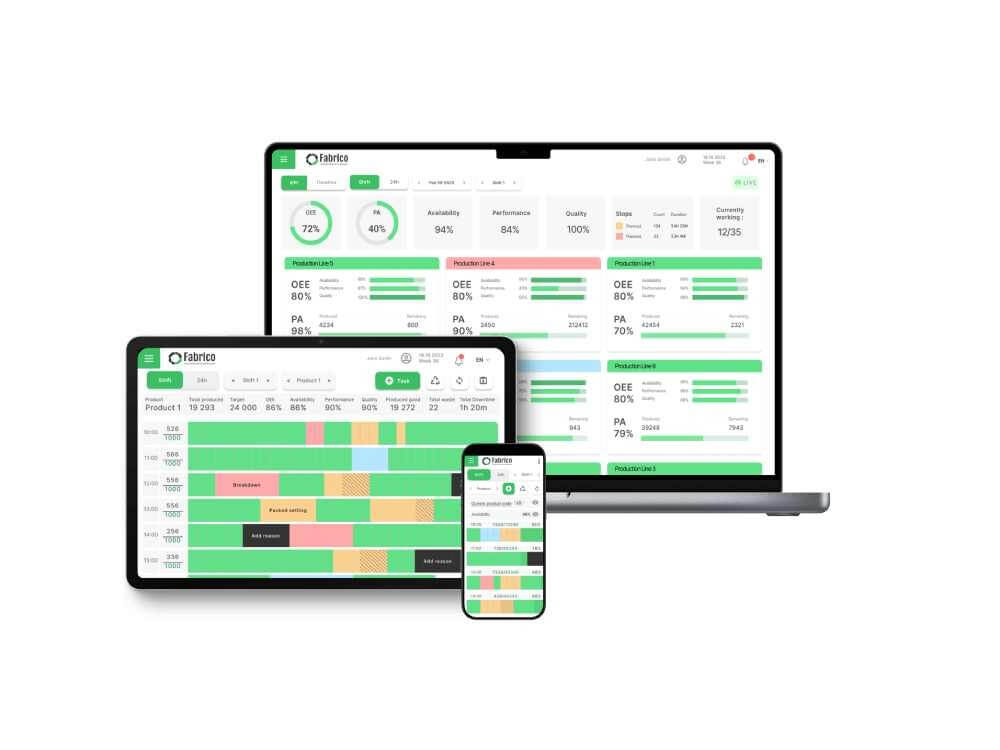
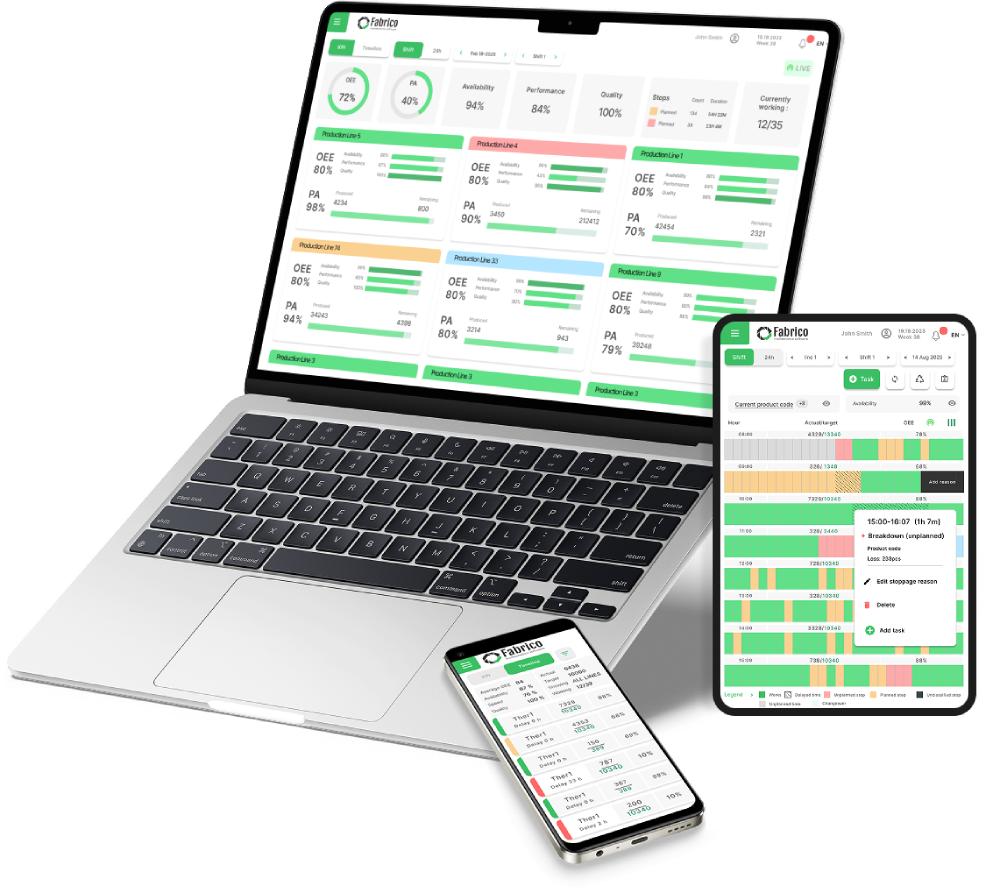
Every factory tracks OEE (Overall Equipment Effectiveness).
It is the gold standard. But OEE is a Scoreboard. It tells you that you lost the game yesterday. It doesn't tell you how to win today.
If you want to drive continuous improvement, you need to look beyond the top-line score. You need to measure the health of the system that produces the OEE.
Here are the 7 KPIs that differentiate World-Class Manufacturers from the rest, and why you need more than a spreadsheet to track them.
1. Schedule Compliance (The "Stability" Metric)
-
What it is: Did we run what we planned to run, when we planned to run it?
-
Why it matters: Low compliance creates chaos. It forces Maintenance to defer PMs and Logistics to expedite shipping.
-
The Fabrico Fix: Use the Interactive Planning Board to visualize conflicts. If you hit 95% Schedule Compliance, OEE usually follows.
2. Planned Maintenance Percentage (PMP)
-
What it is: The ratio of Planned Work (PMs/PdM) vs. Unplanned Work (Emergency Repairs).
-
Why it matters: It costs 4x more to fix a machine after it breaks. World-Class is >80% Planned. Most factories are <40%.
-
The Fabrico Fix: Automate PM triggers based on PLC Cycle Counts. Don't rely on memory; let the machine call for help before it breaks.
3. Mean Time To Repair (MTTR)
-
What it is: The average time from "Machine Stop" to "Full Speed."
-
Why it matters: This measures your Maintenance team's efficiency. A high MTTR usually means technicians can't find parts, manuals, or the root cause.
-
The Fabrico Fix: Use Fabrico Assistant (AI) to instantly find troubleshooting guides and Video Analysis to identify the root cause faster.
4. Micro-Stop Frequency (The "Hidden" Killer)
-
What it is: The number of stops under 2 minutes per shift.
-
Why it matters: Operators often ignore micro-stops, but they destroy flow. 50 stops of 1 minute = 50 minutes of lost production, plus 50 ramp-up losses.
-
The Fabrico Fix: Connect to the PLC. Humans won't log micro-stops. The software must capture them automatically to show the true "Death by a Thousand Cuts."
5. Wrench Time (The "Labor" Efficiency)
-
What it is: The percentage of time a technician spends actually fixing machines (vs. walking, searching for parts, or doing paperwork).
-
Why it matters: Industry average is only 35%. Increasing this to 50% is like hiring free technicians.
-
The Fabrico Fix: Mobile Execution. Give technicians the app. If they can scan a part and close a work order at the machine, they spend less time in the office.
6. First Pass Yield (FPY)
-
What it is: The percentage of product that is good without rework.
-
Why it matters: Rework is the "Hidden Factory." It consumes capacity without adding revenue.
-
The Fabrico Fix: Link Maintenance to Quality. If FPY drops, automatically trigger a "Calibration Check" on the machine.
7. Inventory Turnover (MRO)
-
What it is: How often you rotate your spare parts stock.
-
Why it matters: Low turnover means you have "Dead Capital" sitting on the shelf (obsolete parts). High turnover with stockouts means you are too lean.
-
The Fabrico Fix: Use AI-Driven Min/Max Levels (Roadmap) to right-size inventory based on actual consumption data, not gut feel.
Conclusion: Data Needs to Drive Action
You can calculate these KPIs in Excel once a month. That is "Reporting."
Or, you can track them in real-time. That is "Management."
The difference between a struggling plant and a profitable one isn't the machines; it's the Reaction Time to these metrics.
Don't just watch the scoreboard. Manage the game with Fabrico.