To solve this problem, you need to choose the right category of software. Let's break down the market into four distinct types, moving from the most basic to the most advanced.
Category 1: The Digital Logbook
The Philosophy: "Just get rid of the paper."
This category includes basic CMMS or simple work order software. Its reporting is limited to simple, exportable lists of completed and overdue work orders.
While it's a step up from a spreadsheet, it provides zero business intelligence. It tells you what work was done, but gives you no insight into costs, performance trends, or asset reliability.
Category 2: The Standalone CMMS Dashboard
The Philosophy: "Let's track our core maintenance KPIs."
Most standard CMMS platforms fall into this category. They have good pre-built dashboards for tracking the key "Response Metrics" of a maintenance team: MTTR (Mean Time to Repair), MTBF (Mean Time Between Failures), PM Compliance, and Work Order Costs.
This is a huge improvement and provides a good view of the maintenance department's internal efficiency. However, it's still a silo, which leads directly to the problem Mike faced in our story.
It shows you the performance of your "cure" but is completely disconnected from the "diagnosis" (the real-time operational data).
Category 3: The BI Tool Integration
The Philosophy: "Let's build a custom, all-powerful dashboard."
This approach involves exporting data from your CMMS, your production system, and your ERP into a separate Business Intelligence (BI) tool like Tableau or Power BI.
While infinitely customizable, this is a trap for most companies. It is extremely complex and expensive, requires a dedicated data analyst to build and maintain, and the data is rarely truly real-time. It's a static, backward-looking analysis tool, not a live command center.
Category 4: The Integrated Operations & Maintenance Platform
The Philosophy: "The 'Cure' and the 'Diagnosis' must be on the same screen."
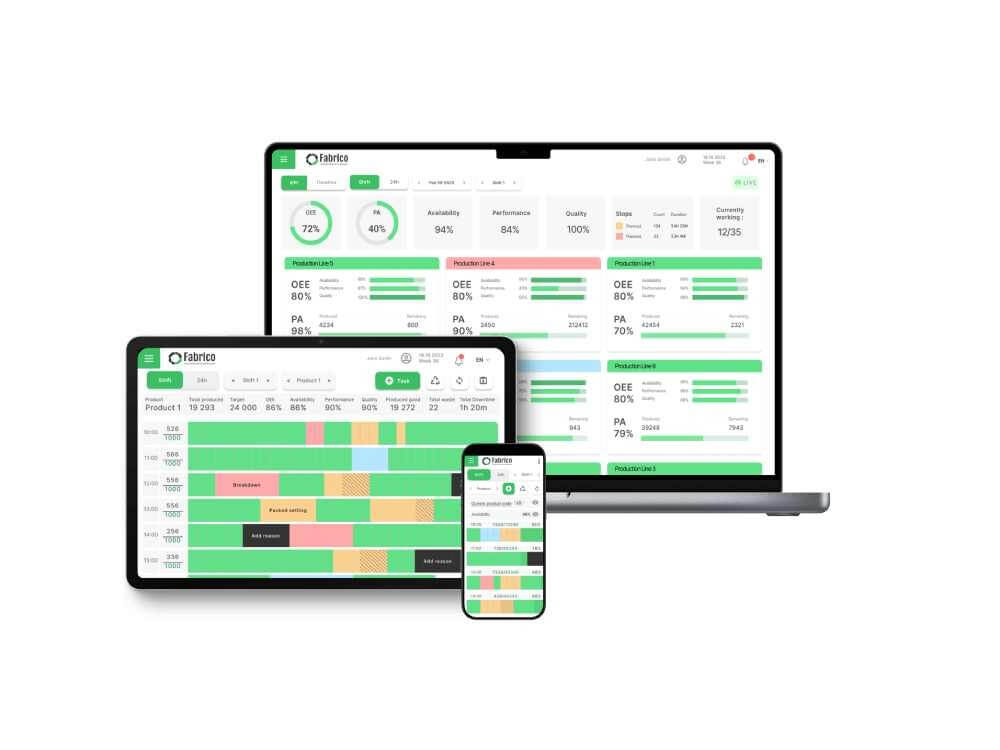
This is the modern, superior approach. It is a single, unified platform where the CMMS and a real-time OEE system are natively integrated from the ground up.
This is the only category that allows you to see the whole picture. The dashboard displays your Maintenance Response KPIs (like MTTR) right next to your Operational Diagnostic KPIs (like OEE Availability).
This finally allows leaders like Paula to see the direct, real-time connection between maintenance actions and production results.
The Fabrico Advantage: Fabrico is the leading example of this integrated approach, providing a single source of truth for your entire operation.
Take a live tour with a product expert