If you walk into a modern factory, you expect to see screens.
Big TVs hanging over the production lines showing green bars, red alerts, and OEE scores.
Visual Management is critical. It tells the team if they are winning or losing the shift.
But there is a trap. Many factories install "Passive Dashboards."
These are screens that show data (often 24 hours old) but don't connect to the tools needed to fix the problems.
You don't just need a TV. You need a Command Center.
Here are the 7 Best Manufacturing Dashboard Tools for 2026, ranked by their ability to turn visualization into action.
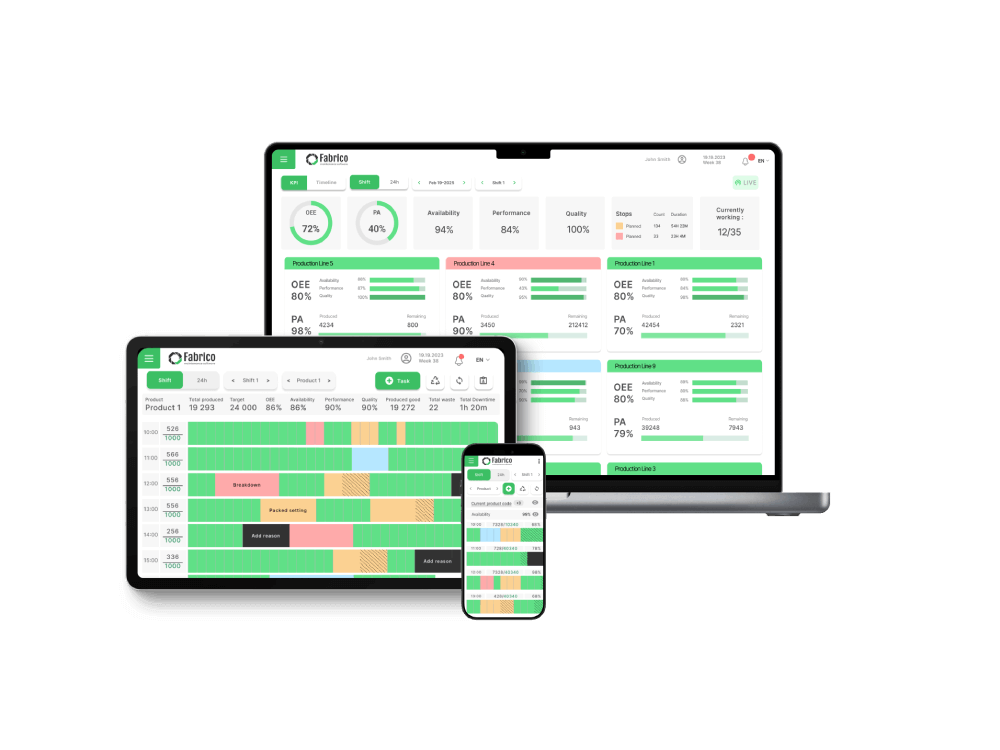
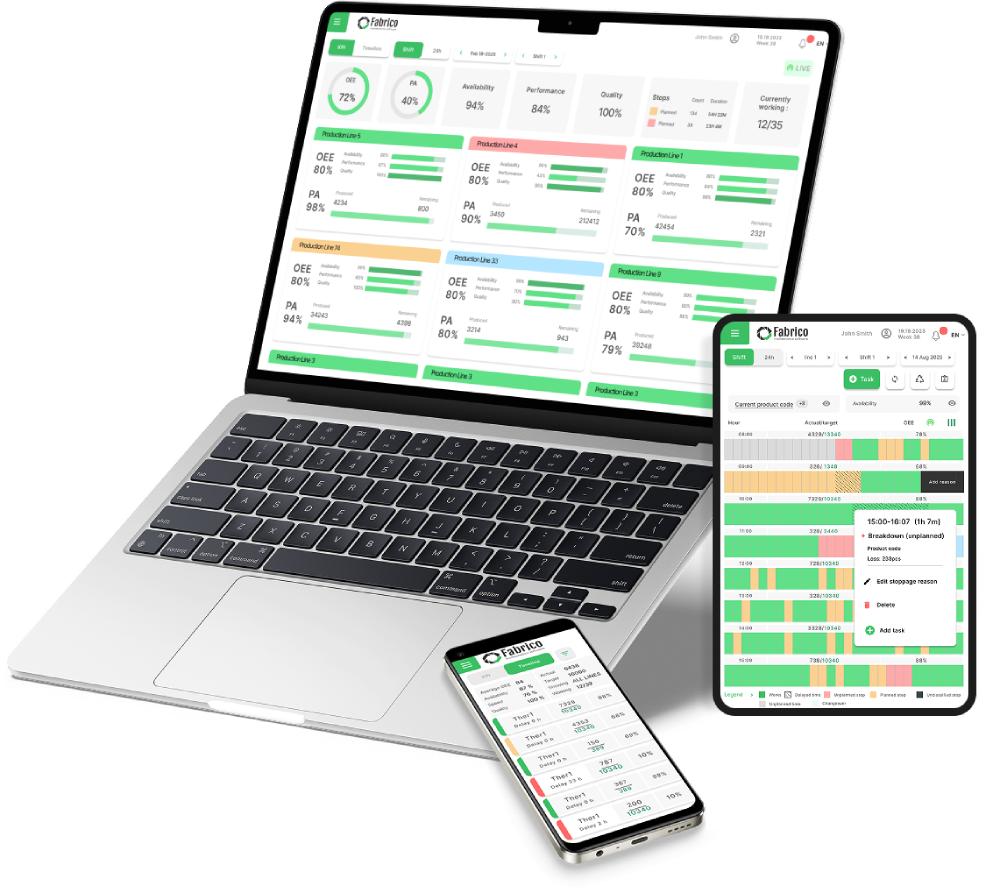
1. Fabrico: The "Interactive" Command Center
Best For: Manufacturers who want to click the dashboard to fix the problem.
Fabrico is not just a visualization tool; it is an operating system. Its dashboards are Active.
Why Plant Managers Choose Fabrico:
-
Click-to-Fix: If the dashboard shows "Line 1 Down," you can click that block to see the root cause and instantly assign a technician. The dashboard is the interface for the work.
-
Unified View: Most dashboards show either Production (OEE) or Maintenance (Work Orders). Fabrico shows both on one screen. You see how maintenance response time is affecting your production output in real-time.
-
Mobile Mirror: The big TV screen is mirrored on every technician's phone. They don't have to walk to the line to see the status; they get the alert in their pocket.
-
No Code Required: You don't need a data scientist to build the chart. Fabrico comes with pre-built industry-standard dashboards for OEE, MTTR, and MTBF.
The Verdict: If you want a dashboard that drives physical action on the floor, Fabrico is the integrated choice.
2. MachineMetrics
Best For: Deep machine analytics and diagnostics.
MachineMetrics excels at visualizing high-frequency machine data.
-
Pros: Beautiful, real-time charts of spindle load, temperature, and cycle times. It identifies micro-stoppages better than almost any other tool.
-
Cons: It focuses on the Machine data. It is less focused on the Workflow data (Spare parts, work orders, safety permits). It tells you the machine is broken, but doesn't inherently manage the fix.
-
The Niche: CNC & Precision Machining.
3. Microsoft Power BI
Best For: Corporate reporting and data analysts.
Power BI is the standard for "Business Intelligence."
-
Pros: Infinite customization. If you have a data analyst on staff, they can pull data from SAP, your MES, and your HR system to create a "God View" of the business.
-
Cons: It is not real-time "Shop Floor" software. It usually refreshes periodically. It is not interactive (you can't click a chart to dispatch a mechanic). It is for analyzing the past, not managing the present.
-
The Niche: Corporate Headquarters.
4. Vorne XL
Best For: The "Big Red Scoreboard."
Vorne is a hardware-based solution. It is the classic LED scoreboard.
-
Pros: Unbeatable visibility. You can see the OEE score from 100 meters away. It requires no IT network to function (if standalone).
-
Cons: It is rigid. You can't easily change the layout or drill down into the data from the screen itself. It is a broadcast tool, not an interactive tool.
-
The Niche: Production Lines needing simple motivation.
5. Redzone
Best For: Gamification and team huddles.
Redzone uses dashboards to drive competition.
-
Pros: The "Winning the Shift" dashboard is famous for motivating operators. It focuses on human performance and team goals.
-
Cons: It is expensive. It focuses more on "Social" metrics (High Fives, Huddles) than on deep asset reliability engineering data.
-
The Niche: Culture-driven plants.
6. Tulip
Best For: DIY Custom Dashboards.
Tulip allows engineers to drag-and-drop widgets to build their own screens.
-
Pros: You can build a dashboard that looks exactly like your machine layout. You can overlay data on a photo of the line.
-
Cons: You have to build it. It requires maintenance and design effort.
-
The Niche: Engineering-led facilities.
7. Grafana
Best For: IT and IoT data visualization.
Grafana is an open-source favorite for visualizing time-series data from IoT sensors.
-
Pros: extremely powerful for visualizing sensor data (vibration, heat) in real-time. Very low cost if you host it yourself.
-
Cons: It is a developer tool. It is not user-friendly for an average maintenance manager. It requires significant technical skill to set up and maintain.
-
The Niche: Tech-savvy IoT teams.
Comparison Matrix: Passive vs. Active
| Feature |
Fabrico |
MachineMetrics |
Power BI |
Vorne |
Redzone |
| Real-Time |
✅ Yes |
✅ Yes |
⚠️ Latency |
✅ Yes |
✅ Yes |
| Interactive |
✅ Click-to-Action |
⚠️ Drill-down |
⚠️ Drill-down |
❌ No |
✅ Social |
| Setup |
Instant |
Fast |
Slow (Build) |
Fast (Hardware) |
Slow (Consulting) |
| Focus |
Ops & Maint. |
Machine Health |
Financials |
Operator Score |
Team Culture |
Summary: Don't Just Watch. Act.
A dashboard should not just be a pretty picture. It should be a Call to Action.
-
Choose Power BI for your monthly board meeting.
-
Choose Vorne for a simple production counter.
-
Choose Fabrico for your Daily Operations. If you want a screen that tells your team exactly what is wrong and gives them the button to fix it immediately, Fabrico is the actionable choice.
Turn your data into repairs.
[Book a Demo with Fabrico] to see our Active Dashboards in action.