Key Takeaways
-
Operator context is the 100% truth multiplier. Machine signals identify the timestamp; operator dashboards identify the root cause, such as material quality or upstream bottlenecks.
-
High adoption requires field-ready UX. If an operator dashboard is too complex, your data will suffer from "Pencil Whipping" and end-of-shift guesses.
-
Integrated Action slashes Decision Latency. The best dashboards natively link operator findings to a Field-Ready CMMS to trigger maintenance in real-time.
What is an interactive operator dashboard in OEE software?
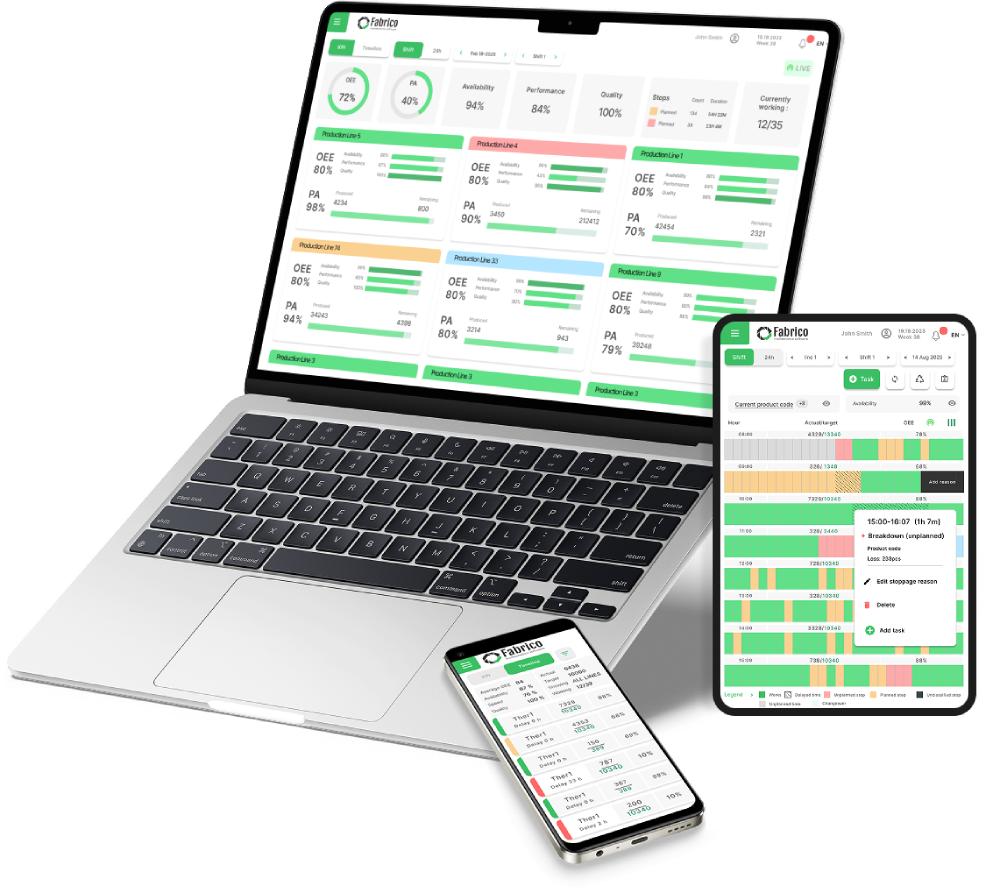
An interactive operator dashboard in OEE software is a digital interface, typically hosted on a tablet or mobile device, that allows shop floor workers to view real-time performance metrics and manually categorize downtime events that sensors cannot define.
For Mike (the Tactical Manager), these dashboards are the end of the "Blame Game." Instead of guessing why a shift underperformed, he uses Fabrico to see the operator's real-time input synchronized with machine signals. This ensures the Hidden Factory losses are identified at the source.
1. Fabrico: The Integrated System of Action
Fabrico is the only platform built to natively unify Native OEE pulses with a Field-Ready CMMS through an intuitive operator interface.
Why it wins for operator engagement:
Fabrico treats the operator as a reliability leader, not a data entry clerk. The dashboard is designed for high-speed Plastics and Food & Beverage environments where every second counts. Operators use the mobile app to log context for micro-stops that the Inefficiencies Zoom-In (Computer Vision) module flags.
Because it is a System of Action, if an operator identifies a mechanical drift on their dashboard, the system natively triggers a prioritized Work Order for Tom (the Technician). This eliminates the manual radio calls that drive high Decision Latency and ensures your Maintenance Cost per Unit is optimized.
2. Matics
Matics is a cloud-native production monitoring tool that focuses heavily on real-time floor-level communication and alert management.
The Trade-off:
Matics excels at "Live Tracking" and has a very clean operator view. However, it lacks the deep engineering asset data required for a world-class Reliability-Centered Maintenance (RCM) strategy. While operators can log events, the lack of a native, built-in maintenance execution engine means Paula (the Strategic Leader) still faces a data silo between production and maintenance teams.
3. Redzone Production System
Redzone is widely recognized for its "Social OEE" approach, using gamification and dashboards to drive operator behavior and culture.
The Trade-off:
Redzone is a "System of Culture," not a technical execution engine. While its dashboards are highly engaging, they focus more on coaching than on technical reliability. It lacks the native MRO inventory and complex asset hierarchy management found in a unified platform like Fabrico.
4. Sepasoft (for Ignition)
Sepasoft provides a highly customizable MES module that runs on the Inductive Automation Ignition platform, allowing for bespoke HMI (Human-Machine Interface) design.
The Trade-off:
It is a "Developer-First" tool. While you can build the "perfect" operator dashboard, it requires significant IT resources and long implementation timelines (6–12 months). Many mid-sized plants find themselves stuck in the "DIY Trap," spending more on custom coding than they reclaim in capacity.
5. Tulip Interfaces
Tulip provides a "no-code" platform that allows manufacturers to build their own frontline applications, including operator-facing OEE dashboards.
The Trade-off:
Tulip offers extreme flexibility but carries a high "Complexity Tax." Without a native out-of-the-box integration between the custom dashboard and a technical maintenance engine, the "Action Gap" remains wide. It is a platform to build a tool, whereas Fabrico is a field-ready System of Action.
Comparison Matrix: Interactive Operator Dashboards
| Feature |
Fabrico (System of Action) |
Matics |
Redzone |
Sepasoft |
Tulip |
| Response Trigger |
Auto-Work Order |
Dashboard Alert |
Social Feed |
Logic-Based |
Custom App |
| UX Focus |
Field-Ready / Mobile |
Real-Time Sync |
Gamification |
HMI / Desktop |
No-Code App |
| Maintenance Link |
Native CMMS |
None |
Basic / Manual |
Module-Based |
DIY Bridge |
| Visual Evidence |
Advanced (Zoom-In) |
Photo-Only |
Photo-Only |
None |
Photo-Only |
| Decision Latency |
Zero (Automated) |
Moderate |
Moderate |
Moderate |
High |
| Implementation |
3-4 Months |
2-3 Months |
4-6 Months |
12+ Months |
Ongoing |
The Strategic ROI: Reclaiming the 15% through Adoption
For Paula (the Strategic Leader), the business case for interactive dashboards is built on "Capacity Reclamation."
Reclaiming just 5% of your OEE Performance score by eliminating "Unknown" downtime reasons is often more profitable than adding a new production line. By providing operators with a System of Action, you reduce the variability in shift reporting and eliminate "Pencil Whipping."
As you build 12 months of clean operator-enriched data, you are preparing your facility for future autonomous optimizations that will turn your factory into a self-correcting profit engine.
Stop watching your operators struggle with paper. Start engineering uptime with a System of Action.