The "Black Box" Problem: In many factories, you can't tell if a machine is running or broken just by looking at it. Data is hidden in databases or logbooks.
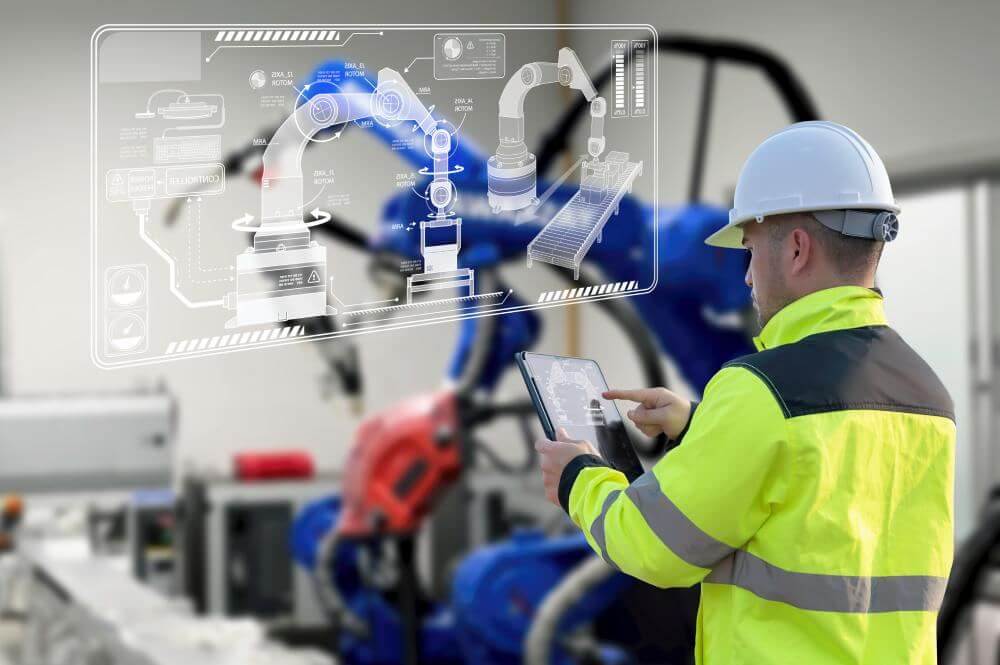
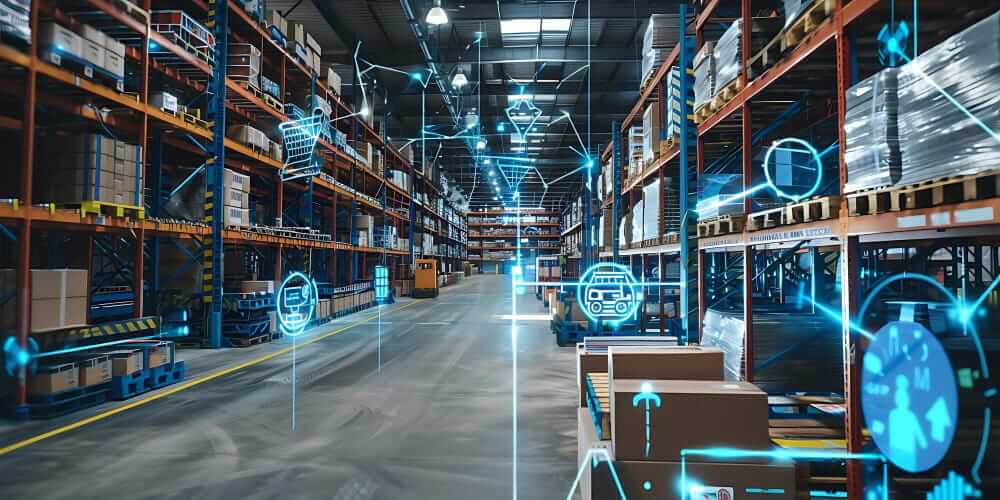
The "Glass Wall" Standard: A Visual Factory makes the status of every asset, order, and metric visible to everyone in real-time.
The Top 7: We review Fabrico, Tulip, Vorne, and others to help you turn your shop floor into a transparent, data-driven environment.
The Visual Factory is a core Lean Manufacturing concept.
The rule is simple: "Any person should be able to walk onto the floor and understand the status of production within 5 seconds."
In the past, this meant whiteboards, Andon lights, and taped floors.
In 2026, this means Digital Signage and Mobile Dashboards.
If your data is hidden inside a computer in the manager's office, you do not have a Visual Factory. You have a "Black Box."
To drive accountability and speed, you need software that broadcasts the truth to the people who can act on it.
Here are the 7 Best Visual Factory Software Tools for 2026.
Best For: Manufacturers who want to visualize Maintenance Health and OEE on a single map.
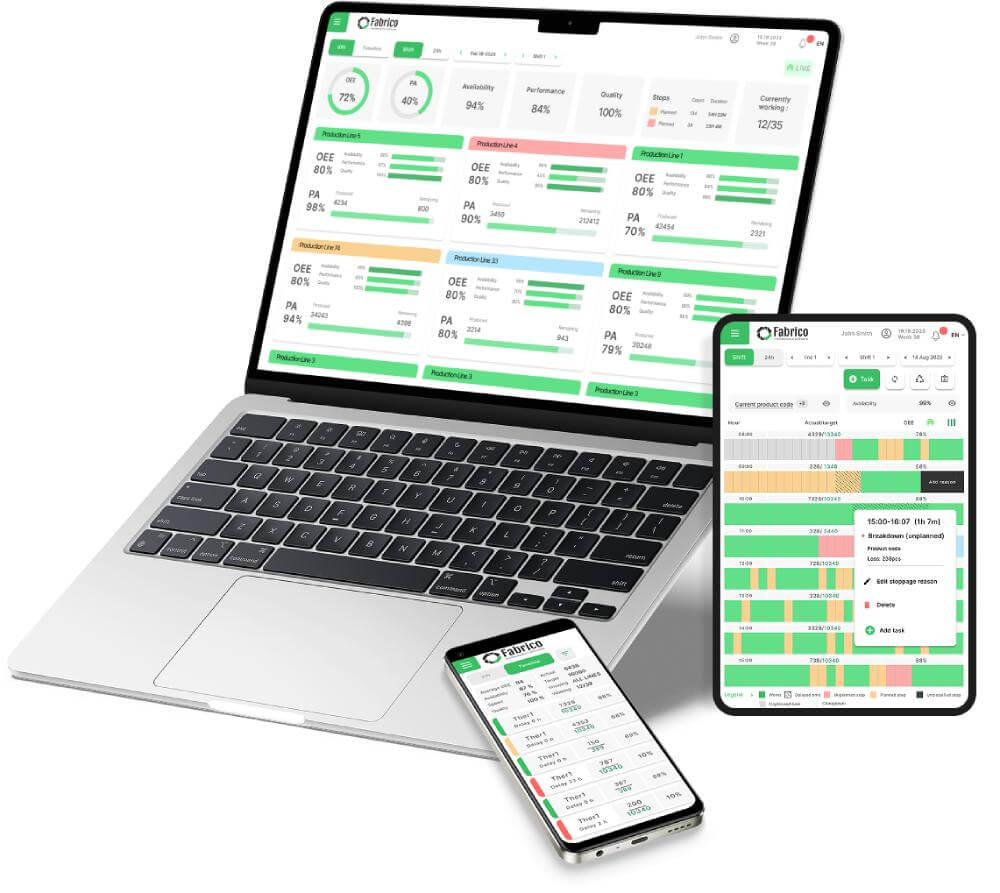
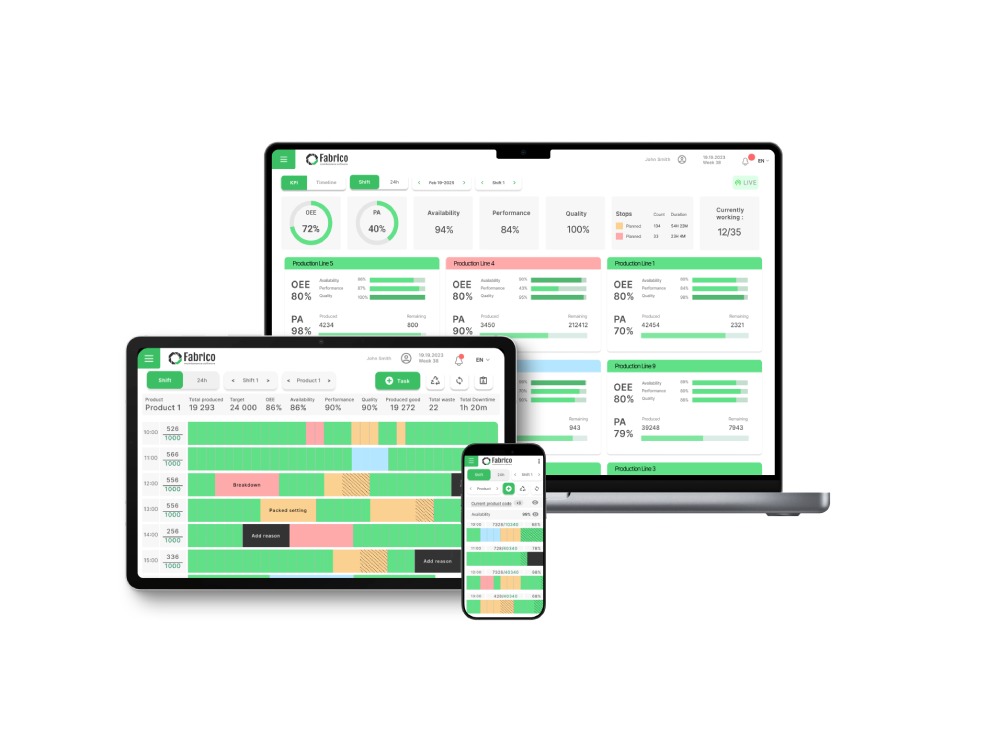
Fabrico brings the Visual Factory to life by creating a digital representation of your production lines. It doesn't just show numbers; it shows context.
The Visual Asset Tree: Instead of a spreadsheet list of assets, Fabrico uses a hierarchical tree. You can drill down from "Factory" -> "Line" -> "Machine" -> "Motor" visually.
Real-Time Status Broadcasting: Fabrico pushes OEE data (Red/Green status) to TV screens on the shop floor and tablets in technicians' pockets. Everyone knows the score.
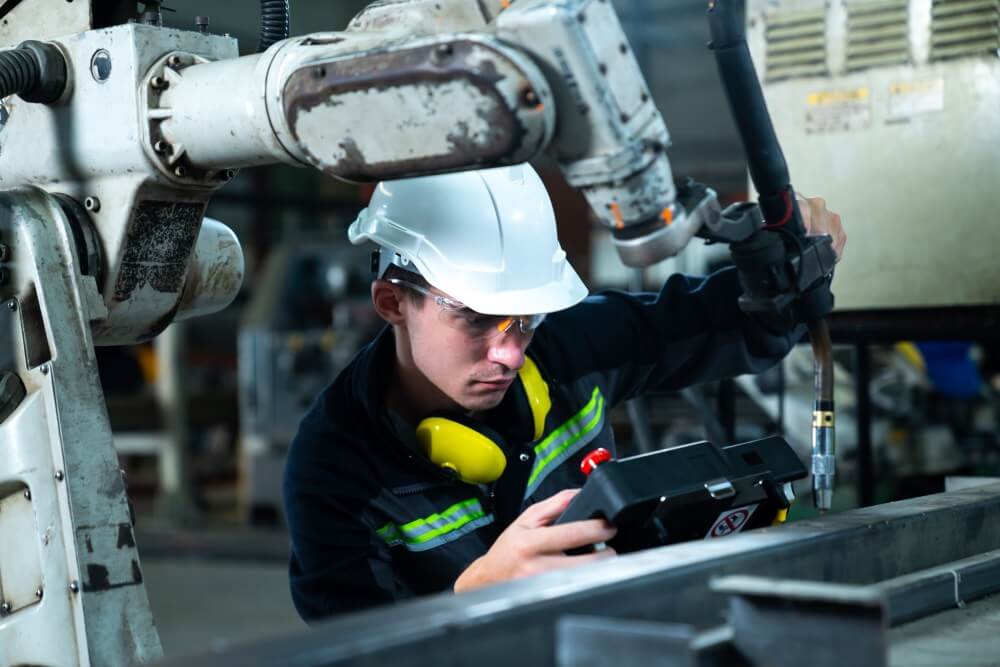
Visual Work Orders: Technicians don't just read text. They see photos, diagrams, and digital markups of the breakdown. "See it, fix it."
The "Andon" Link: When an operator triggers a digital Andon alert in Fabrico, it visualizes the call for help on the dashboard, showing exactly where the bottleneck is physically located.
The Verdict: If you want to see your factory's pulse in real-time, Fabrico is the modern standard.
Best For: Custom shop floor apps and interfaces.
Tulip is a "No-Code" platform that lets you build your own visual interfaces.
Pros: You can build a "Digital Shadow Board" or a custom interactive map of your facility. You can overlay live data onto a photo of the machine.
Cons: It requires design effort. You are building the visualization from scratch. It is not a "plug-and-play" solution for maintenance management.
The Niche: DIY Engineering teams.
Best For: The "Big Red Scoreboard."
Vorne is the classic hardware solution for Visual Factories.
Pros: Unmatched physical visibility. A giant LED sign showing "Target vs. Actual" is the ultimate visual cue. It requires no interaction to be effective.
Cons: It is limited to production counts. It doesn't visualize maintenance backlogs, spare parts locations, or detailed failure modes.
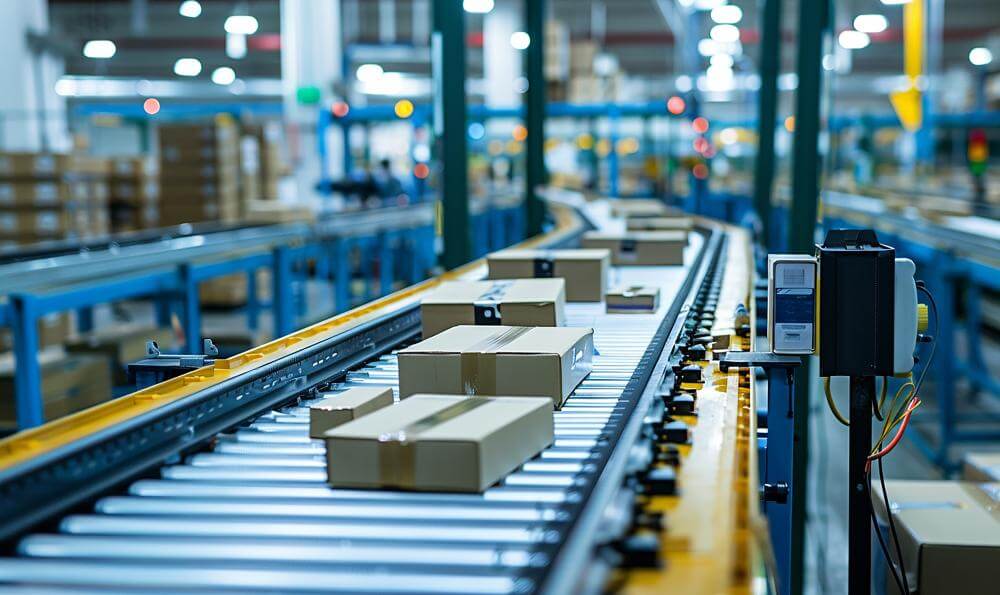
The Niche: High-volume production lines.
Best For: Dispatch visualization.
L2L excels at visualizing the "Flow of Work."
Pros: Their "CloudDISPATCH" screen shows a live feed of problems and who is fixing them. It’s like an "Air Traffic Control" screen for the factory floor.
Cons: The interface can be dense. It is focused on dispatching people rather than visualizing asset health.
The Niche: Large, multi-team facilities.
Best For: CNC machine status monitoring.
If you run a machine shop, MachineMetrics provides the best visualization of spindle status.
Pros: Color-coded timelines show exactly when a machine was cutting, idle, or in setup. The "Load Meter" visualizations are excellent for operators.
Cons: It focuses on the machine controller data. It doesn't visualize the broader factory context (safety, facilities, manual assembly) as well as a broader platform.
The Niche: Precision Machining.
Best For: Social visualization and team huddles.
Redzone uses visuals to drive culture.
Pros: The "Huddle Board" feature replaces the physical whiteboard. It shows team wins, trends, and actions in a format designed for group meetings.
Cons: It is expensive. It visualizes people performance more than asset reliability.
The Niche: Workforce engagement.
Best For: Digitizing "Lean Rooms" and whiteboards.
iObeya essentially puts sticky notes on a giant touchscreen.
Pros: If you love your physical Kanban board or SQDIP board but want it digital, this is the direct replacement. Great for morning meetings.
Cons: It is disconnected from the equipment. It doesn't pull live data from the PLC; humans have to move the digital sticky notes.
The Niche: Digital War Rooms.
| Feature | Fabrico | Tulip | Vorne | L2L | iObeya |
| Live Machine Data | ✅ Native | ✅ Custom | ✅ Native | ✅ Native | ❌ No |
| Interactive | ✅ Yes | ✅ Yes | ❌ No | ✅ Yes | ✅ Yes |
| Maintenance Link | ✅ Deep | ⚠️ DIY | ❌ No | ✅ Dispatch | ❌ No |
| Setup Speed | Fast | Slow | Fast | Medium | Fast |
| Cost | Value | High | Hardware | High | Mid |
A problem hidden in a database is a problem that won't get fixed.
Choose Vorne if you just want a scoreboard.
Choose iObeya if you just want a digital whiteboard.
Choose Fabrico if you want a Live Operating Picture. If you want to see OEE drops, maintenance tickets, and safety alerts on a single visual platform that drives action, Fabrico is the integrated choice.
Turn the lights on.
[Book a Demo with Fabrico] to see how our Visual Factory tools expose waste and improve response times.