Menu
OEE Quality: A Manager's Guide to Reducing Scrap and Rework

OEE Quality: A Manager's Guide to Reducing Scrap and Rework

Key Takeaways

  • OEE Quality measures the percentage of good parts produced out of the total parts started, also known as First Pass Yield. The world-class benchmark is 99.9%.

  • The formula is a simple ratio: Quality = Good Count / Total Count.

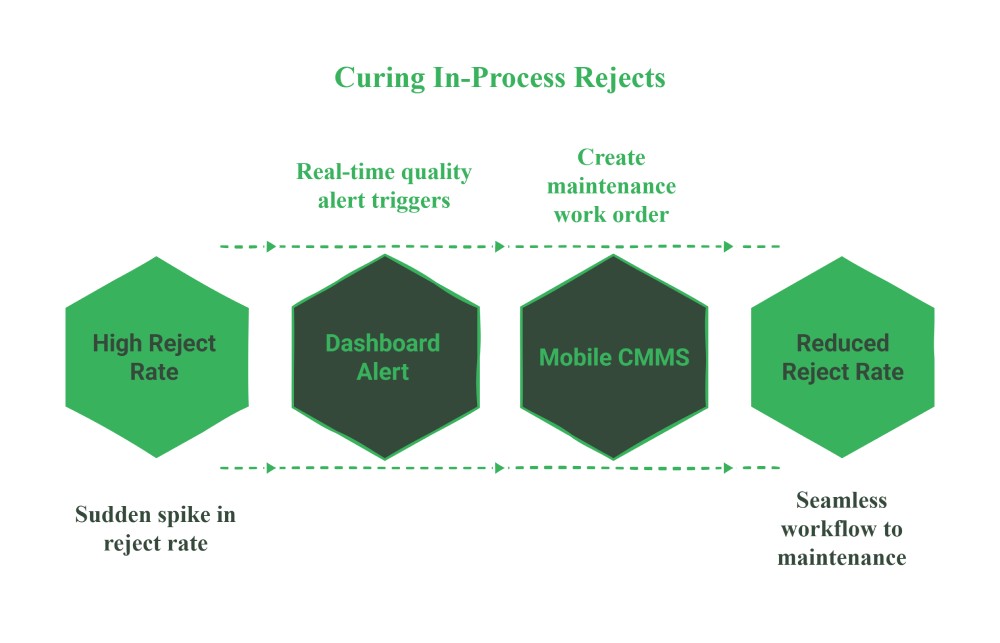
  • There are two types of quality loss: In-Process Rejects (often a machine health issue) and Startup Rejects (often a process or setup issue).

  • A true solution doesn't just track these losses; it uses an integrated CMMS to cure them by triggering maintenance actions and standardizing setup procedures.

OEE Quality: A Manager's Guide to Reducing Scrap and Rework

The High Cost of "Acceptable" Scrap

OEE Quality is the measure of First Pass Yield. It answers the simple, brutal question, "How many good parts did we make, with no rework required?"

For many companies, a certain level of scrap is just considered the cost of doing business. But it's a massive hidden cost.

Paula, a COO, is reviewing the monthly profit and loss statement. She sees a huge line item for "scrap and rework costs" that directly eats into her profit margin. At the same time, her Plant Manager, Mike, is frustrated.

His team is constantly being blamed for quality issues, but they don't have the data to know if the problem is the machine, a bad setup, or the raw materials.

How to Calculate OEE Quality: A Clear Example

The formula for OEE Quality is the most straightforward of the three OEE components.


The Formula Explained

The formula is a simple percentage: Quality = Good Count / Total Count.

  • Total Count: The total number of parts that were started and produced, including both good and bad parts.

  • Good Count: The number of parts that met quality standards on the first pass, with no rework needed.


A Practical Example


Imagine a single shift where:

  • Total Parts Produced = 300 parts

  • Rejected Parts = 15 parts

First, calculate your Good Count:

  • Good Count = 300 - 15 = 285 parts

Next, calculate your Quality score:

  • Quality = 285 / 300 = 95%

Curing In-Process Rejects (The Machine Health Problem)

The first type of quality loss is in-process rejects. These are defects that occur during the steady, normal run of production.


The Diagnosis: Real-Time Defect Tracking


These defects are often caused by issues related to machine health: worn tooling, incorrect settings drifting over time, or a component that is beginning to fail.

An OEE system with a simple operator interface on a tablet makes this diagnosis instant. You can see a spike in the defect rate the moment it starts, allowing you to pinpoint the exact machine, shift, and product run that is having the problem.


The Cure: Data-Driven Maintenance Actions

This is the Fabrico workflow in action. A rising defect rate is a maintenance alarm bell.

The insight from your OEE system allows Mike to take targeted action in the integrated CMMS. He can see the defect data and immediately create a work order for a machine inspection and calibration.

Over time, he can analyze the history to see if quality dips happen when a specific PM task is overdue, allowing him to fine-tune his maintenance strategy. It connects the quality problem directly to the maintenance solution.

Curing Startup Rejects (The Process Problem)

The second type of quality loss is startup rejects. These are the defects and wasted materials that happen at the very beginning of a run, right after a changeover.


The Diagnosis: Pinpointing Post-Changeover Waste


These defects are most often caused by an improper or inconsistent machine setup.

An OEE system that tracks yield per production run can easily diagnose that the first 100 units after every changeover on Machine #5 are being scrapped, a problem that might otherwise be invisible.


The Cure: Standardized Digital Workflows


This is a process failure, and the cure is a standardized, repeatable process.

The most reliable way to fix this is by using your CMMS to attach a digital changeover checklist and SOP to the work order.

This guides the operator, Tom, through the correct procedure every time, requiring him to confirm key steps and settings.

This simple workflow virtually eliminates setup errors as a root cause of startup rejects.

Take a live tour with a product expert
Schedule a Demo

Quality as an Early Warning System for Breakdowns

Here's a strategic insight that most companies miss: a sudden drop in quality is often a leading indicator of a future breakdown. A part that is slightly out of spec is a symptom of a machine that is about to fail completely.

An integrated OEE and CMMS system allows you to see this correlation. You can look at the history of a major breakdown and see that it was preceded by a dip in the quality score.

This turns your quality data into a powerful predictive tool that can help your maintenance team prevent catastrophic availability losses.

Frequently Asked Questions (FAQ)

What is a good OEE Quality score?


The industry benchmark for "world-class" Quality is 99.9%. This means only 1 in 1,000 parts is defective. An average score is often around 95-98%, but every single percentage point gained has a direct and significant impact on profitability.


What is the difference between Quality and First Pass Yield (FPY)?


In the context of OEE, they are essentially the same. The OEE Quality metric is a measure of First Pass Yield—the percentage of parts that are made correctly the first time without any need for rework.


How do you get operators to accurately report scrap?


You make it simple and part of their standard workflow. With a user-friendly system, reporting a defect can be as simple as one tap on a tablet. When operators see that reporting scrap accurately leads to maintenance actions that fix the machine and make their job less frustrating, they become willing partners in the process.

Stop Accepting Scrap. Start Systematizing Quality.

Poor quality isn't just a cost of doing business; it's a symptom of a broken system. By diagnosing the root cause—whether it's machine health or process inconsistency—and applying the right cure through an integrated system, you can turn a major cost center into a powerful competitive advantage.

Ready to see the integrated system that helps you diagnose and cure the root causes of poor quality?


Book a personalized demo of Fabrico today.

Latest from our blog

Still Wondering?
Check for Yourself!
Still Wondering?

Schedule a 1-to-1 meeting with our experts or directly enroll in our Free Plan.
No Credit Card required!

By clicking the Accept button, you are giving your consent to the use of cookies when accessing this website and utilizing our services. To learn more about how cookies are used and managed, please refer to our Privacy Policy and Cookies Declaration