Passive OEE refers to software that collects and displays machine performance data for reporting purposes, whereas integrated OEE is a unified platform that natively connects that performance data to a Field-Ready CMMS to automatically trigger maintenance tasks and process optimizations.
For Mike (the Tactical Manager), a passive scoreboard is a source of frustration.
It tells him he is losing money but forces him to manually radio a technician to find out why.
Fabrico eliminates this friction by ensuring that every performance dip is instantly converted into a prioritized task on a mobile device.
Visibility without execution is merely a high-definition view of your own losses.
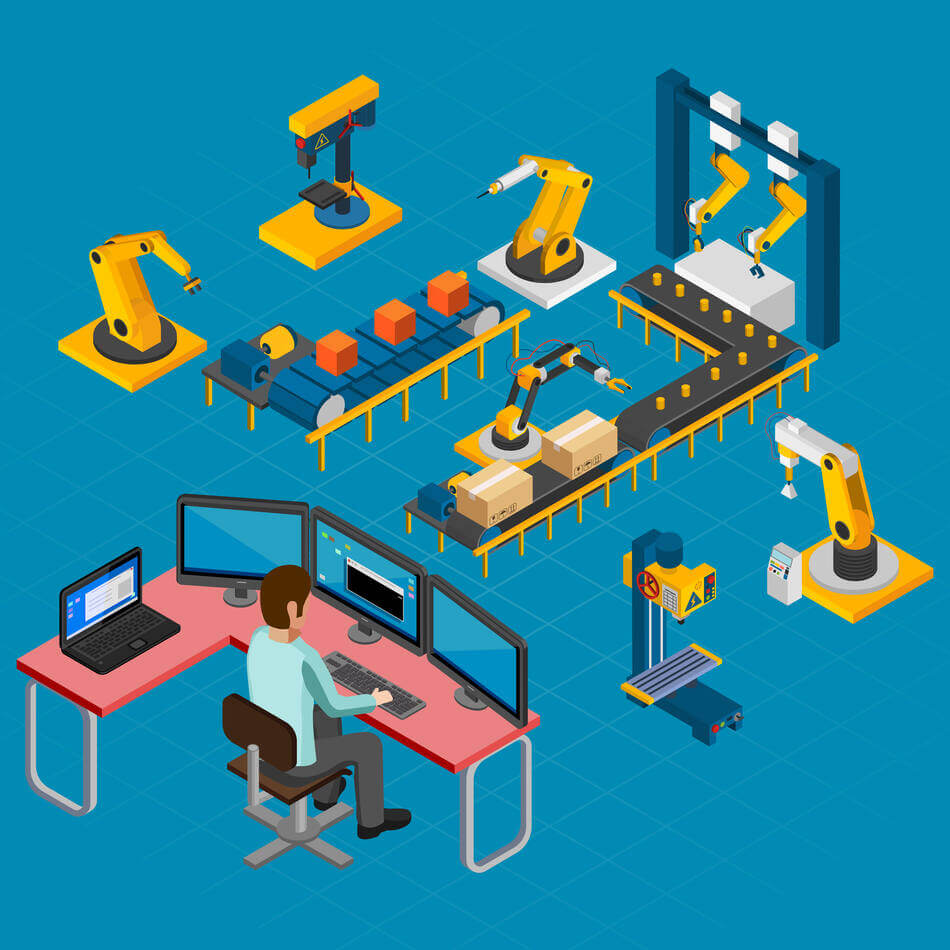
Many plants install "Scoreboard" software that shows a red 65% OEE on a large TV, yet the technicians on the floor have no digital instructions on how to turn it green.
This creates "Dashboard Fatigue," where teams stop looking at the numbers because the software provides no clear path to resolve the underlying mechanical causes.
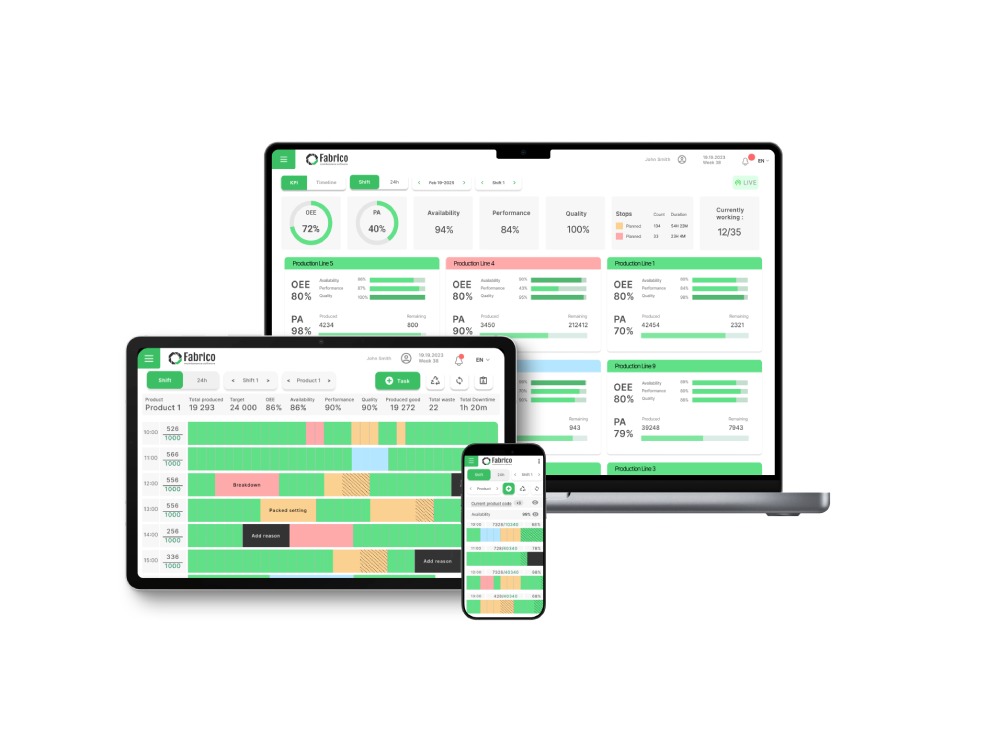
Fabrico bridges this "Action Gap" by ensuring that data always leads to a task through the Visibility Trifecta, PLC signals, operator context, and AI-powered Computer Vision.
The hallmark of a world-class factory is the speed of its "Fault-to-Fix" cycle.
In a disconnected environment, this cycle can take hours; in an integrated OEE and CMMS like Fabrico, it takes seconds.
Detection: Fabrico’s Native OEE module detects a cycle time slowdown via direct PLC or Computer Vision.
Verification: The Inefficiencies Zoom-In module captures a visual "replay" of the event, confirming the root cause (e.g., a jammed feeder or worn belt).
Execution: The system automatically triggers a prioritized Work Order, providing Tom (the Technician) with the digital SOP and parts list.

By closing this loop, you reclaim the revenue capacity that was previously lost to inefficient communication and slow diagnostics.
| Capability | Passive OEE Scoreboards | Siled OEE Apps | Fabrico (System of Action) |
| Response Trigger | Visual Alert Only | Email / Notification | Automated Mobile Work Order |
| Maintenance Link | None | Via API (Complex) | Native Integrated CMMS |
| Micro-stop RCA | Basic / Manual | Data-Only | Advanced Visual Zoom-In |
| Mobile UX | N/A | Browser-Based | Field-Ready Native App |
| Decision Latency | High (Hours) | Moderate | Zero (Automated) |
| Implementation | Days (Hardware) | 6-12 Months | 3-4 Months (Full Factory) |
For Paula (the Strategic Leader), the business case for Fabrico is built on reclaiming lost capacity without purchasing new hardware.
By identifying "Bad Actor" assets through real-time data, she can move her team to Condition-Directed Tasks on the machines that actually drive revenue.
This reduces the Maintenance Cost per Unit and ensures that her multi-million dollar assets reach their full residual value.
As you gather 12 months of clean operational data, you are also preparing the facility for the Fabrico Agent (AI Roadmap), which will eventually automate these production flows.
Stop watching the score. Start engineering uptime with a System of Action.
Investing in OEE software is often the first step toward digital transformation, but there is a massive financial divide between simply "monitoring" a line and "engineering" its uptime.
Most manufacturers are stuck with passive scoreboards that report on yesterday’s failures, while market leaders use integrated systems to reclaim their "Hidden Factory" in real-time.
To achieve a true return on investment, you must move beyond dashboards and into a unified System of Action.
Passive OEE is a "System of Record" that documents losses without providing the mobile tools to fix them.
Integrated OEE is a "System of Action" that natively links production performance to maintenance execution.
Decision Latency is the primary differentiator. The faster a machine signal becomes a work order, the higher your total plant profitability.