There is a terrifying sound in a factory. It isn't the grinding of gears or the screeching of metal.
It is silence.
When the line stops, cash stops flowing in, but expenses keep flowing out.
Every Plant Manager has a "Cost of Downtime" number in their head. Maybe it's $5,000 an hour.
But financial studies consistently show that manufacturers underestimate this cost by 200% to 300%.
Why? Because they are looking at the Invoice, not the Impact.
They fall victim to the Iceberg Effect. They see the repair bill, but they miss the massive structural damage happening below the waterline.
If you want to get budget approval for better tools (like OEE software or CMMS), you need to stop calculating the "Repair Cost" and start calculating the "Total Business Impact." Here is the formula.
Layer 1: The Visible Tip (Direct Costs)
This is what your accountant sees.
-
Maintenance Labor: The overtime pay for the technicians fixing the machine.
-
Spare Parts: The cost of the motor, bearing, or sensor.
-
Operator Labor: Paying 10 operators to stand around and watch the technicians work.
The Mistake: If you stop here, you think the downtime cost $2,000. You are wrong.
Layer 2: The Waterline (Inventory & Quality)
This is what happens to the product during the failure.
-
Spoilage / Scrap: In food or chemical processing, a stop often ruins the batch stuck in the pipe. In plastics, you have to purge the screw.
-
Startup Losses: Machines rarely restart perfectly. The first 50 units after a restart are often scrapped as you dial in the settings.
-
WIP Stagnation: Work-in-Progress piles up, tying up cash and floor space.
The Reality: You just added another $5,000 in material waste.
Layer 3: The Deep Impact (Opportunity Cost)
This is the number that scares the CFO.
-
Lost Revenue: If your factory is "Capacity Constrained" (you can sell everything you make), every hour of downtime is an hour of revenue that is gone forever. You cannot make it up without overtime.
-
Expedited Shipping: To catch up, you have to ship the order via Air Freight instead of Truck. That premium comes directly out of your margin.
-
SLA Penalties: In automotive (Tier 1) or retail, missing a delivery window results in massive contractual fines.
The Reality: That one hour of downtime just cost you $20,000 in lost sales and fines.
Layer 4: The Bedrock (Cultural Erosion)
This is the hardest to measure, but the most dangerous.
-
The "Stress" Tax: Constant firefighting burns out your best people. When your Lead Technician quits because they are tired of 2 AM calls, you lose 10 years of tribal knowledge.
-
Safety Risk: Rushed repairs lead to accidents. Statistics show that injury rates spike during unplanned maintenance interventions.
How to Melt the Iceberg
You cannot manage this risk with a clipboard.
Paper logs capture the "Big Stops" (30+ minutes). They miss the "Micro-Stops" and "Speed Losses" that bleed your capacity death by a thousand cuts.
To calculate the True Cost of Downtime, you need Automated Intelligence.
-
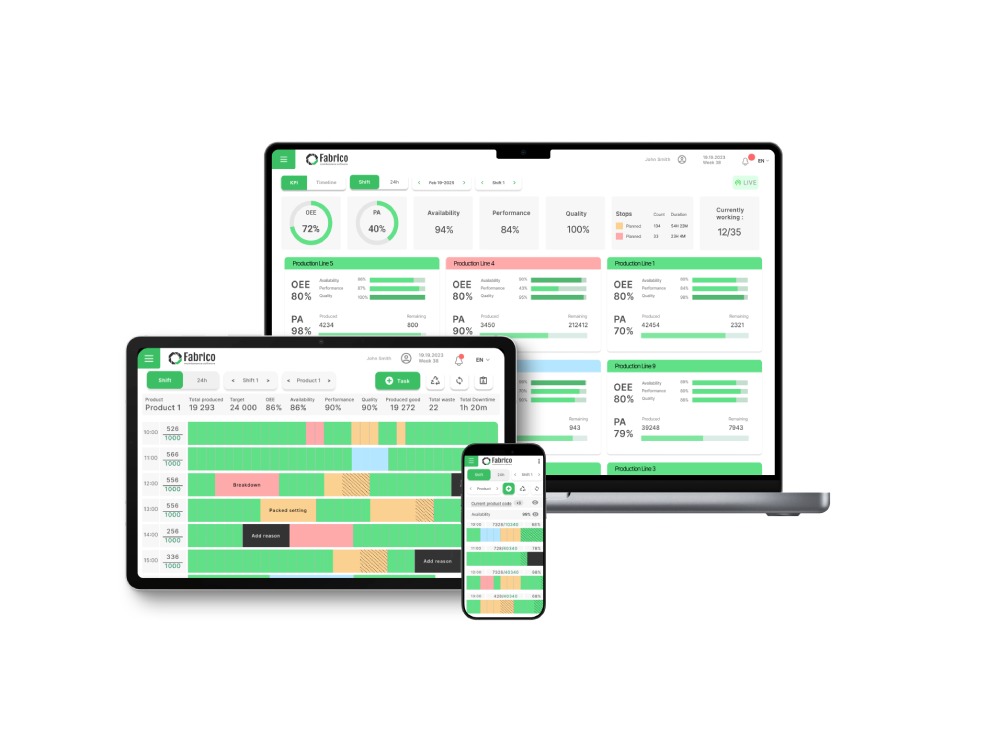
Automated OEE: Connect Fabrico to your PLCs. Capture every second of downtime.
-
Categorize the Loss: Use Video Analysis to determine why it stopped. Was it a jam? A breakdown? A material shortage?
-
Assign the Dollar Value: Configure your dashboard to multiply downtime minutes by your Real Cost per Minute (e.g., $400/min).
Conclusion: Visibility is Profit
When you show the CFO that a "small" jam actually costs the company $50,000 a month in Lost Opportunity, the budget for maintenance software is approved instantly.
Don't let the iceberg sink your quarter.
Start measuring the true cost of downtime with Fabrico today.