Imagine driving a car where the speedometer is hidden in the glove box, the fuel gauge is in the trunk, and the GPS is printed on paper in the back seat.
You would crash.
Yet, this is how many factories operate.
-
Production status? Hidden in the ERP.
-
Machine health? Hidden in a logbook.
-
Quality standards? Hidden in a binder.
This environment requires "Management by Hunting." You have to hunt for the information.
The goal of the Visual Factory is "Management by Sight." Information finds you.
In 2026, the Visual Factory isn't just about putting tape on the floor (5S). It is about building a Digital Nervous System that visualizes the invisible.
Here is the guide to turning the lights on.
1. The Andon Effect (Status Visualization)
In the Toyota Production System, the Andon Cord is a rope an operator pulls to stop the line and light up a board.
It screams: "I have a problem!"
In a modern factory, the Andon is digital.
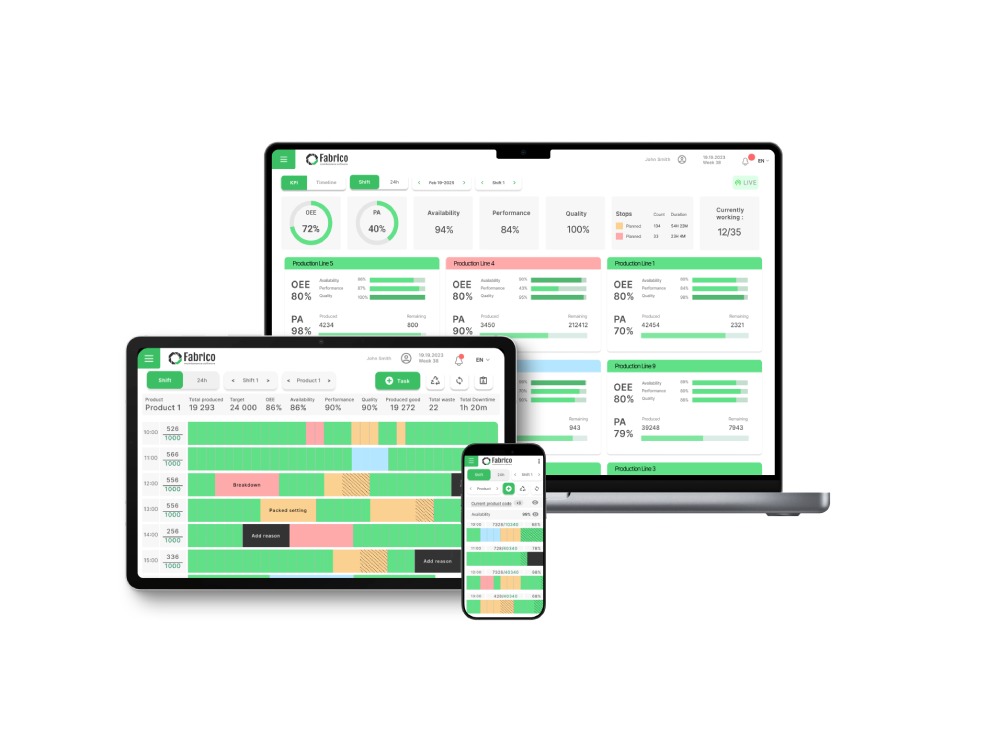
2. Radiating Performance (The OEE Scoreboard)
People play differently when they can see the score.
If operators don't know if they are winning or losing, they pace themselves comfortably.
The Strategy: Real-Time OEE Displays.
-
The Setup: Place a monitor at the end of every line.
-
The Data: Show "Target vs. Actual."
-
The Psychology: When the bar is Green, the team feels good. When it turns Yellow, they naturally speed up or look for the bottleneck. You don't have to micromanage; the screen does it for you.
3. Visual Work Instructions (The IKEA Model)
Why is IKEA furniture easy to build? No text. Only pictures.
Why are Standard Operating Procedures (SOPs) hard to follow? Too much text.
The Strategy: Visual Standardization.
-
The Old Way: "Ensure the valve is in the open position (horizontal)."
-
The Visual Way: A photo of the valve with a Green Checkmark.
-
The Implementation: Fabrico displays these images directly on the technician's tablet during the checklist. There is no interpretation. There is only matching the picture.
4. Seeing the "Ghost" (Video Capture)
Some problems are too fast to see. A jam happens in a millisecond.
A visual factory doesn't just show static data; it shows Motion.
The Strategy: Inefficiencies Zoom-In.
-
The Tool: Cameras integrated with the maintenance software.
-
The Visibility: When a machine faults, the system presents a video clip of the event.
-
The Value: You can "See" the root cause (e.g., a wobbling guide rail) that is invisible when the machine is stopped.
5. Visual Inventory (The Shadow Board)
In 5S, we use "Shadow Boards" so you know if a tool is missing.
We need this for Spare Parts.
-
The Digital Shadow Board: Your inventory software should show a photo of the part, not just a part number.
-
The Scenario: A technician needs a "Solenoid Valve." There are 5 boxes.
-
The Fix: They look at the photo on the app. They match it to the box. They pick the right part. Visuals reduce picking errors.
Conclusion: Making Problems Ugly
The purpose of a Visual Factory is to make problems "Ugly."
You want a breakdown to turn the screen Red. You want a missed inspection to leave a gap in the chart.
When problems are ugly, they get fixed. When they are hidden, they fester.
Turn on the screens.
[Request a Demo] and see how Fabrico visualizes your factory operations.