Every Plant Manager wants to run a "World Class" operation. But what does that actually mean?
Is it having the newest robots? Is it having a clean floor?
In 2026, World Class Maintenance (WCM) is defined by data, not aesthetics. It is a rigorous standard of reliability where the maintenance department is no longer a cost center, but a competitive advantage.
If you are still running your maintenance on paper, whiteboards, or fragmented spreadsheets, you are likely operating at "Average" levels (or below).
Here are the hard numbers that define the top 10% of manufacturers, and the digital strategies required to join them.
The 3 Pillars of World Class Performance
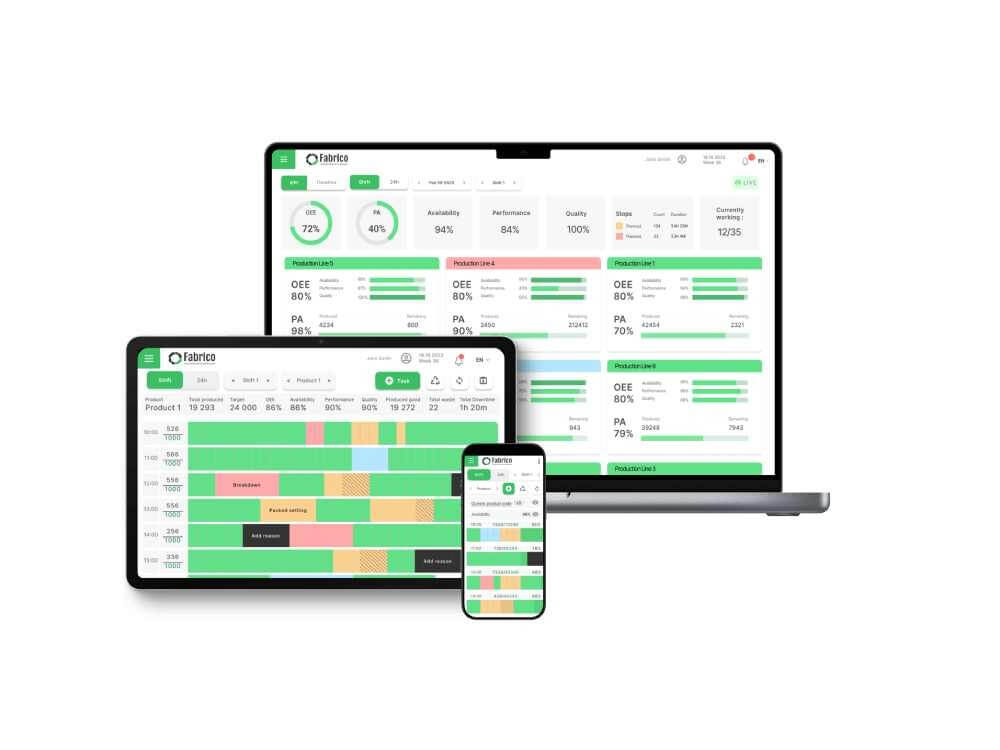
1. The OEE Benchmark: > 85%
Overall Equipment Effectiveness (OEE) is the ultimate scorecard. It multiplies Availability x Performance x Quality.
-
Average Factory: 60% OEE. (Hidden losses in micro-stops and slow cycles).
-
World Class: 85% OEE.
-
How to get there: You need Unified Data Intelligence. You must connect your CMMS to your machines. If maintenance doesn't know why the machine stopped (Downtime Reason), they can't fix the root cause. Fabrico’s "Inefficiencies Zoom-In" (Video) is the tool that closes the gap between 60% and 85%.
2. The Planning Benchmark: > 80% Planned Work
This is the "Reactive Ratio."
-
Average Factory: 40% Planned / 60% Reactive. (Constant firefighting).
-
World Class: 80% Planned / 20% Reactive.
-
How to get there: You need a Planned Maintenance System that works. This means using Condition-Based Triggers (PLC data) rather than calendar guesses. It means using AI Scheduling (Fabrico Agent) [Roadmap] to find opportunistic windows to work so you don't interrupt production.
3. The Schedule Compliance Benchmark: > 90%
It's one thing to plan the work; it's another to do it.
-
Average Factory: 50-70% Compliance. (PMs are skipped because "Production wouldn't give us the machine").
-
World Class: > 90% Compliance.
-
How to get there: Integration. Maintenance schedules must be visible on the Production Planning Board. When both departments share a single "Source of Truth" (Fabrico), maintenance is prioritized, not deferred.
The Financial Impact: Cost of Unreliability
Why chase these numbers? Because the gap between "Average" and "World Class" is millions of dollars in Maintenance Cost per Unit.
-
Reactive costs 3x-5x more than Planned (Overtime, Rush Parts, Collateral Damage).
-
Low Inventory Accuracy (< 90%) leads to "Squirrel Stashes" and emergency air-freight costs.
World Class plants run efficiently. They spend money on improving assets, not rescuing them.
Comparison: Where Do You Stand?
| Metric |
The Laggard (Reactive) |
The Average (Preventive) |
World Class (Reliability) |
| OEE |
< 50% |
60% - 70% |
> 85% |
| Planned Maint. |
< 20% |
50% |
> 80% |
| Inventory Accuracy |
Unknown |
80% |
> 98% |
| Data Source |
Paper / Memory |
Excel / Legacy CMMS |
Real-Time PLC + AI |
| Decision Speed |
Days/Weeks |
Hours |
Instant |
The Fabrico Framework: Your Ladder to World Class
You cannot jump from Laggard to World Class overnight. You need a maturity model.
-
Digitize (Level 1): Remove paper. Implement Fabrico Mobile to capture accurate data.
-
Connect (Level 2): Integrate PLCs. Move from Calendar PMs to Usage-Based PMs.
-
Analyze (Level 3): Use the OEE Dashboard to identify your "Bad Actor" assets (the 20% causing 80% of pain).
-
Optimize (Level 4): Deploy the Fabrico Agent[Roadmap] to automate scheduling and inventory logic.

Conclusion: Stop Accepting "Good Enough"
"Average" is a dangerous place to be in modern manufacturing. Average plants get shut down. World Class plants get investment.
The difference isn't the machinery; it's the management system.
Measure your gap.
[Request a Demo] and see how Fabrico visualizes your path to World Class.