
Choosing the best OEE software with video replay is the only way to move beyond "guessing" why your high-speed lines are underperforming.
Traditional sensors identify that a machine has stopped, but they are notoriously blind to the operator motions and mechanical snags that define the Hidden Factory.
To achieve world-class results in 2026, you must implement a unified System of Action that adds visual proof to every production heartbeat.
See OEE & CMMS live in 15 minutes.
Book a demoPLCs identify the "When"; Video identifies the "Why." Capturing visual proof of every jam or slow cycle is the only way to achieve 100% root cause certainty.
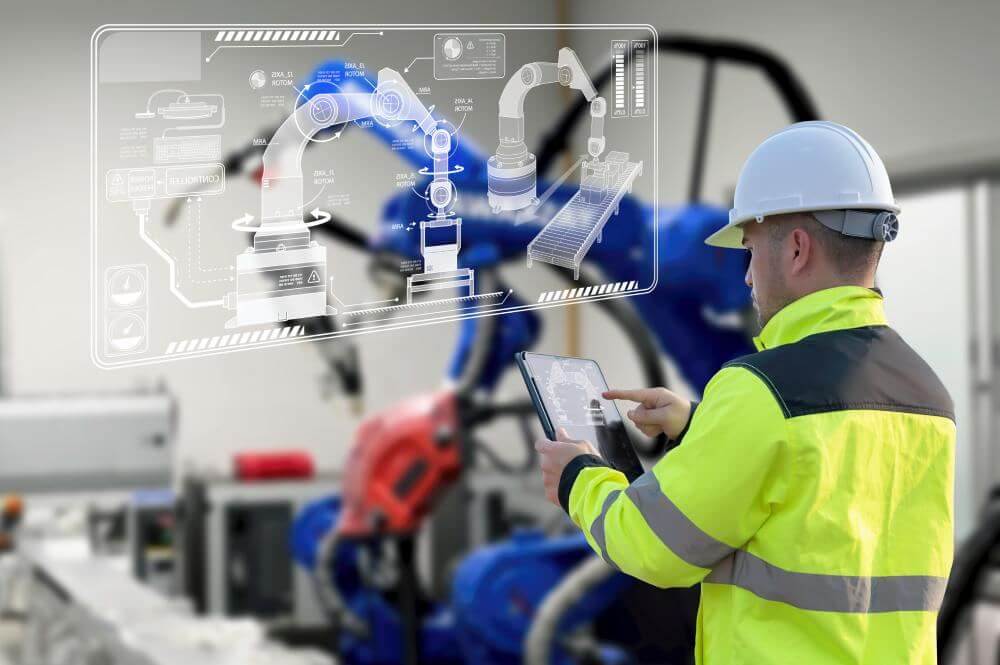
Visual RCA slashes MTTR. Technicians arrive at the machine prepared after watching a 10-second "Zoom-In" replay of the failure on their mobile devices.
Integration is the tie-breaker. Visual truth is a sunk cost if it doesn’t natively trigger a prioritized repair task in a Field-Ready CMMS.
Visual root cause analysis (RCA) is a digital diagnostic capability that synchronizes real-time machine performance data (OEE) with high-definition video footage to provide technicians with an undeniable record of downtime events.
By using AI-powered cameras above the production line, these systems capture micro-stops and jams that occur too fast for the human eye to accurately recall.
For Mike (the Tactical Manager), this is the end of the "Blame Game" between shifts.
He uses the visual truth to move his facility from "Monitoring Failure" to "Engineering Uptime" through evidence-based fixes.
Fabrico is the only platform built from the ground up to natively unify Native OEE, AI-powered Computer Vision, and a Field-Ready CMMS into a single source of truth.
Why it wins for high-speed reliability:
Fabrico utilizes the proprietary Inefficiencies Zoom-In module to capture the 15% of losses that traditional PLCs miss.
When a cycle-time deviation or micro-stop is detected, the system automatically flags a video clip of the exact failure moment.
Because it is a System of Action, the system doesn't just log the fault; it triggers a prioritized Work Order for Tom (the Technician).
Tom scans the machine's QR Code, views the "Replay" on his tablet, and executes the fix based on facts, ensuring the Value Fulcrum is balanced in real-time.
MachineMetrics is a powerhouse in the industrial IoT space, specializing in deep machine connectivity and high-frequency data for discrete manufacturing.
The Trade-off:
While their data collection and predictive analytics are world-class, they primarily function as a "System of Intelligence."
They offer some visual monitoring integrations, but these are often treated as a secondary "add-on" rather than a native trigger for technical execution.
For Paula (the Strategic Leader), this creates an "Action Gap," as technical insights must still be manually pushed to a separate maintenance system.
Drishti focuses heavily on "Action-Recognition" AI, specifically designed to analyze human-centric workflows on manual assembly lines.
The Trade-off:
Drishti is a world-class diagnostic tool for manual work, providing deep data on operator movement and process adherence.
However, it lacks the deep technical maintenance execution of a full CMMS for automated equipment.
It identifies human-induced downtime well but struggles to natively manage the mechanical spare parts and asset history required for complex automated repairs.
Sight Machine specializes in creating a "Digital Twin" of the entire manufacturing process by consolidating data from across the enterprise.
The Trade-off:
Their platform is highly sophisticated but functions primarily as a "System of Record" for data scientists and analysts.
In a high-pressure shift, the implementation is too heavy for Tom (the Technician).
It lacks the technician-friendly simplicity required to manage real-time repairs at the point of work.
Worximity focuses on "Smart Factory" connectivity and provides real-time OEE visibility through an intuitive "Tile" interface.
The Trade-off:
Worximity excels at real-time floor communication and machine tracking for mid-sized plants.
However, it lacks the advanced Computer Vision layer and deep engineering asset data required for a full Reliability-Centered Maintenance (RCM) strategy.
It tracks the downtime event but doesn't provide the high-definition "Zoom-In" replay required to fix recurring mechanical drifts permanently.
| Feature | Fabrico (System of Action) | MachineMetrics | Drishti | Sight Machine | Worximity |
| Visual Proof Logic | Native Zoom-In | API-Based | Action AI | Digital Twin | Photo-Only |
| Response Trigger | Auto-Work Order | Dashboard Alert | Dashboard Only | Dashboard Only | Dashboard Alert |
| Maintenance Link | Native CMMS | Siled / API | None | None | Siled / API |
| Mobile Experience | Native Offline App | Browser-Based | Tablet-First | Low (Desktop) | Browser-Based |
| Decision Latency | Zero (Automated) | Moderate | Moderate | High | Moderate |
| Implementation | 3-4 Months | 4-6 Months | 6-9 Months | 12+ Months | 2-3 Months |
For Paula (the Strategic Leader), the business case for a visual System of Action is built on "Capacity Reclamation."
Reclaiming just 5% of availability by reducing diagnostic time is often more profitable than purchasing a new production line.
By identifying "Bad Actor" assets through real-time 3D data (Machine + Human + Vision), you move your team from reactive "firefighting" to a proactive reliability strategy.
This ensures your multi-million dollar assets reach their full residual value while simultaneously lowering your Maintenance Cost per Unit.
Stop managing your downtime in the past. Start engineering your reliability with a System of Action.
Want OEE captured straight from your machines — no manual logs?
See it live