Menu
OEE Performance: A Guide to Uncovering Your "Hidden Factory"

OEE Performance: A Guide to Uncovering Your "Hidden Factory"

Key Takeaways

  • OEE Performance measures how close your machines are to their maximum theoretical speed while they are running. The world-class benchmark is 95%.

  • The formula is (Ideal Cycle Time × Total Count) / Run Time.

  • The main causes of performance loss—Slow Cycles and Minor Stops—are often invisible to manual tracking. They can only be accurately diagnosed with an automated, real-time data collection system.

  • The most effective way to improve performance is to treat the data as an early warning system, using it to trigger proactive maintenance inspections in an integrated CMMS.

OEE Performance: A Guide to Uncovering Your "Hidden Factory"

What is OEE Performance? (And Why It’s So Hard to Track)

Of the three OEE factors, Performance is the most subtle and difficult to master.

While a machine breakdown (Availability) is obvious and a scrapped part (Quality) is tangible, a machine running just 7% slower than it should be is nearly invisible.

Performance answers the question, "How fast were we running, as a percentage of our top speed?"

It measures the losses that occur while the machine is still running—the "hidden factory" that is quietly stealing your capacity.

Mike, a Production Manager, knows his shift's output is low, but his downtime log doesn't show any major stops.

He suspects the machines are just running slower than they used to, but he has no data to prove it or to identify which machine is the real culprit. He's blind to his biggest problem.

How to Calculate OEE Performance: A Clear Example

The formula for Performance looks simple, but its power depends entirely on the accuracy of the data you feed it.

The Formula Explained

The formula is: Performance = (Ideal Cycle Time × Total Count) / Run Time.

  • Ideal Cycle Time: The theoretical fastest possible time to produce one part, as specified by the manufacturer or your own engineering standards.

  • Total Count: The total number of parts produced during the shift, including both good and bad parts.

  • Run Time: The time the machine was scheduled to run and was not stopped for a breakdown or a planned changeover.
     

 A Practical Example


Let's use the data from a single shift:

  • Run Time = 380 minutes

  • Ideal Cycle Time = 1 minute/part

  • Total Parts Produced = 300 parts

Now, let's calculate the Performance score:

  • Performance = (1 minute × 300 parts) / 380 minutes = 78.9%

This score means that while the machine was running, it was operating at only 78.9% of its full potential speed. The next question is, why?

The Two Hidden Killers of Your Performance Score


Two types of losses are responsible for a poor Performance score. Both are nearly impossible to track with a stopwatch and a spreadsheet.

Slow Cycles: The Silent Thief


The Diagnosis: This is when a machine is producing parts, but its actual cycle time is slower than the ideal cycle time. It could be due to worn equipment, incorrect settings, poor-quality raw materials, or even an inexperienced operator.

An automated OEE system that tracks every cycle in real-time is the only way to make this loss visible and quantify its impact.
 

Minor Stops: Death by a Thousand Cuts
 

The Diagnosis: These are the brief, 30- to 90-second stops that operators like Tom often clear without ever logging. A blocked sensor, a jammed conveyor, a misfeed on a press. Individually, they seem insignificant.

But when they happen 50 times a shift, they add up to a massive source of lost time. Only a real-time monitoring system can capture and aggregate these "micro-stops" to reveal their true cost.

The Cure for Poor Performance: An Integrated Early Warning System

Once you can see these hidden losses, how do you cure them? The most effective approach is to treat your Performance data as a predictive early warning system for your maintenance team.


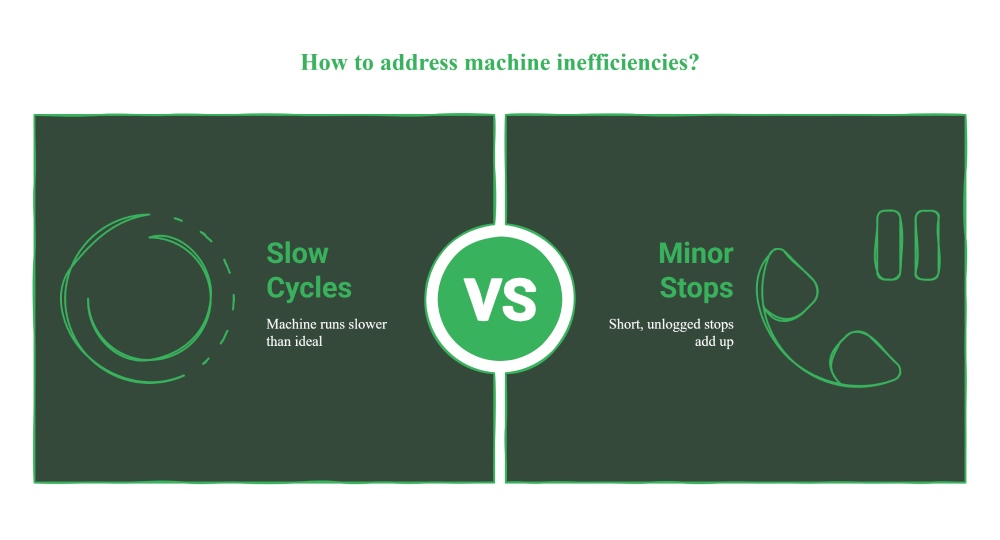
Step 1: Make the Invisible, Visible (The Diagnosis)


The first step is to implement a system like Fabrico that automatically tracks every cycle and every micro-stop in real-time. This is the powerful diagnostic tool that finally gives you a true, accurate picture of your performance losses. You stop guessing and start seeing the reality on the factory floor.
 

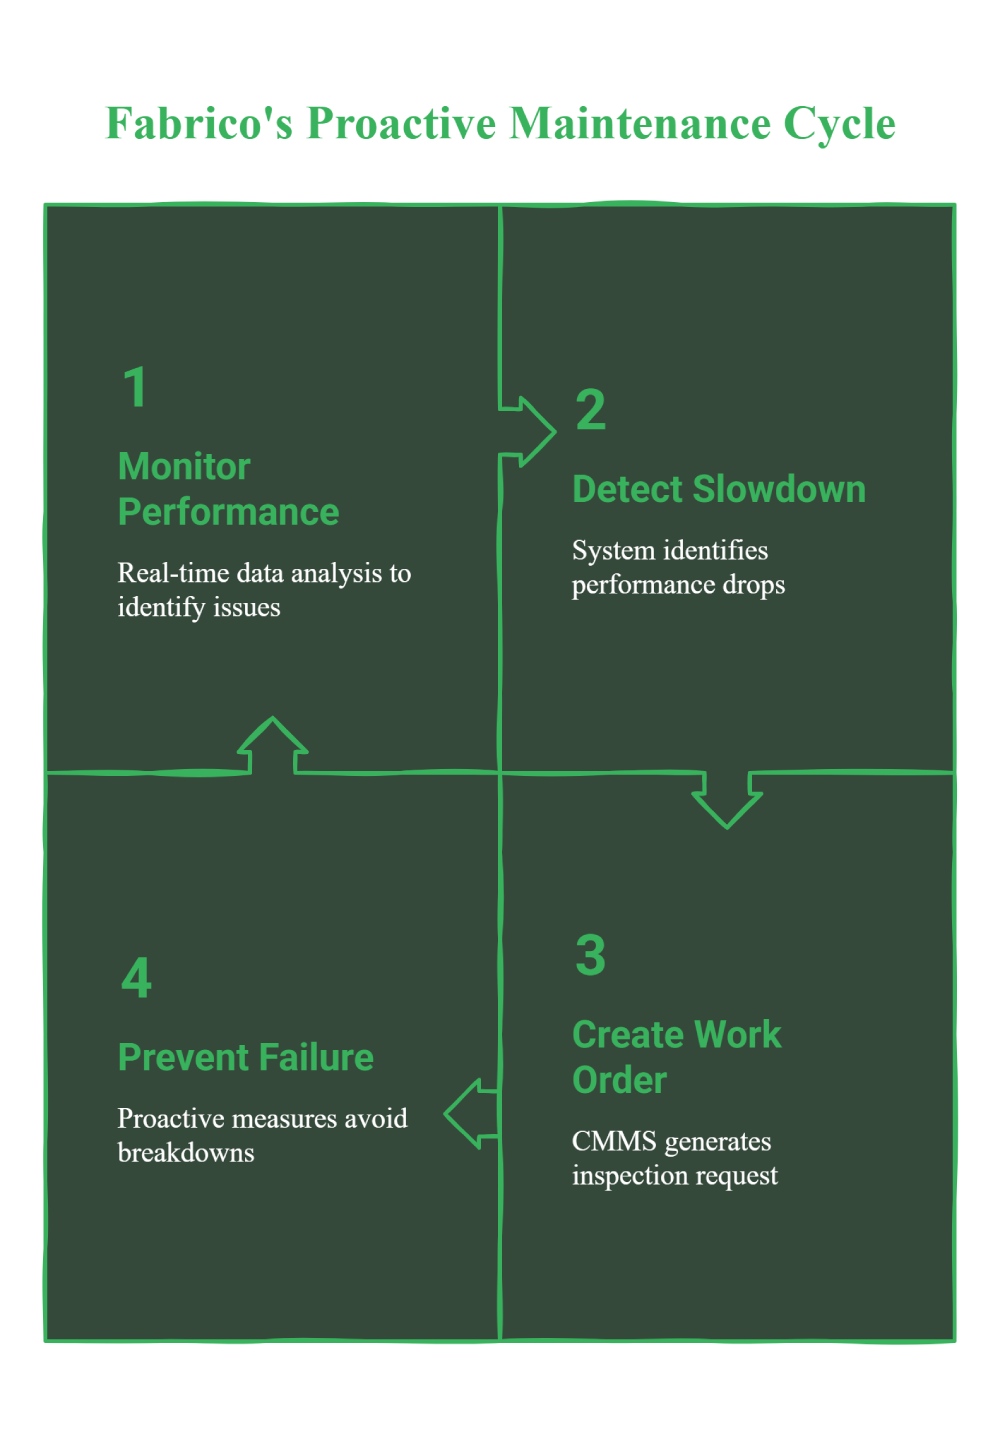
Step 2: Treat Performance Loss as a Maintenance Trigger (The Cure)


This is the critical connection that most companies miss. A machine that is running slow is often a machine that is about to break down completely.

The Fabrico Workflow: When the OEE system detects that a machine's average cycle time has increased by 5% over the last 24 hours (the diagnosis), it's not just a number on a chart. It's an early warning signal.

This insight allows a manager like Mike to proactively create a maintenance inspection work order in the integrated CMMS (the cure) to investigate the root cause before it leads to a catastrophic failure and a massive, costly availability loss.

Take a live tour with a product expert
Schedule a Demo

Frequently Asked Questions (FAQ)

What is a good OEE Performance score?


The industry benchmark for "world-class" Performance is 95%. An average score is often between 80-90%. A score below 80% usually indicates that significant "hidden factory" losses are occurring.


How do we determine the "Ideal Cycle Time"?


The best source is the original equipment manufacturer's (OEM) specification for "nameplate capacity." If this is not available or is unrealistic, you can determine it by running the machine under ideal conditions for a short period to find its fastest possible sustainable speed.

Can operator inexperience affect the Performance score?


Yes. An inexperienced operator may run a machine at a slower-than-ideal speed or cause more minor stops.

OEE data can be a valuable tool for identifying where additional training and support are needed.

Stop Guessing. Start Seeing.

You can't fix the problems you can't see. The "hidden factory" of performance losses can only be uncovered with an automated, real-time system.

And those insights only become truly valuable when they are used to trigger proactive maintenance before small problems become big breakdowns.

Ready to see the hidden factory in your own operations?

 Book a personalized demo of Fabrico today.

Latest from our blog

Still Wondering?
Check for Yourself!
Still Wondering?

Schedule a 1-to-1 meeting with our experts or directly enroll in our Free Plan.
No Credit Card required!

By clicking the Accept button, you are giving your consent to the use of cookies when accessing this website and utilizing our services. To learn more about how cookies are used and managed, please refer to our Privacy Policy and Cookies Declaration