What is Visual OEE Monitoring?
Visual OEE monitoring is an advanced production analytics framework that synchronizes real-time machine performance data (OEE) with high-definition video footage (Computer Vision) to provide an undeniable record of every downtime event, micro-stop, and process deviation.
For Mike (the Tactical Manager), visual truth is the end of the "Blame Game."
When a high-speed labeler jams fifty times a shift, the PLC simply logs "Stop."
Fabrico's Inefficiencies Zoom-In module flags the video clip, allowing Mike to see if the cause was a material defect, an operator adjustment, or a vibrating guide rail.
Dimension 1: Capturing the "Hidden Factory" with Computer Vision
The Hidden Factory represents the 15-20% of capacity lost to micro-stops that are too fast for sensors to explain and too frequent for operators to log manually.
In high-speed Food & Beverage and Plastics lines, these "Ghost Losses" are often filtered out as noise by traditional OEE tools.
Fabrico utilizes the Visibility Trifecta—PLC signals, operator context, and visual evidence—to ensure no loss remains invisible.
By identifying and fixing these recurring micro-events, you reclaim capacity without purchasing a single new piece of hardware.
Dimension 2: Slashing MTTR via Visual Diagnostics
Mean Time to Repair (MTTR) is often inflated by "Diagnostic Latency"—the time technicians spend investigating why a machine failed.
Standalone OEE dashboards identify a fault but provide no technical context to Tom (the Technician).
Fabrico’s integrated OEE and CMMS ensures that Tom receives a smart notification on his mobile device containing a 10-second "Replay" of the failure.
This visual proof allows him to arrive at the machine with the correct tools and parts, reducing diagnostic time by up to 50%.
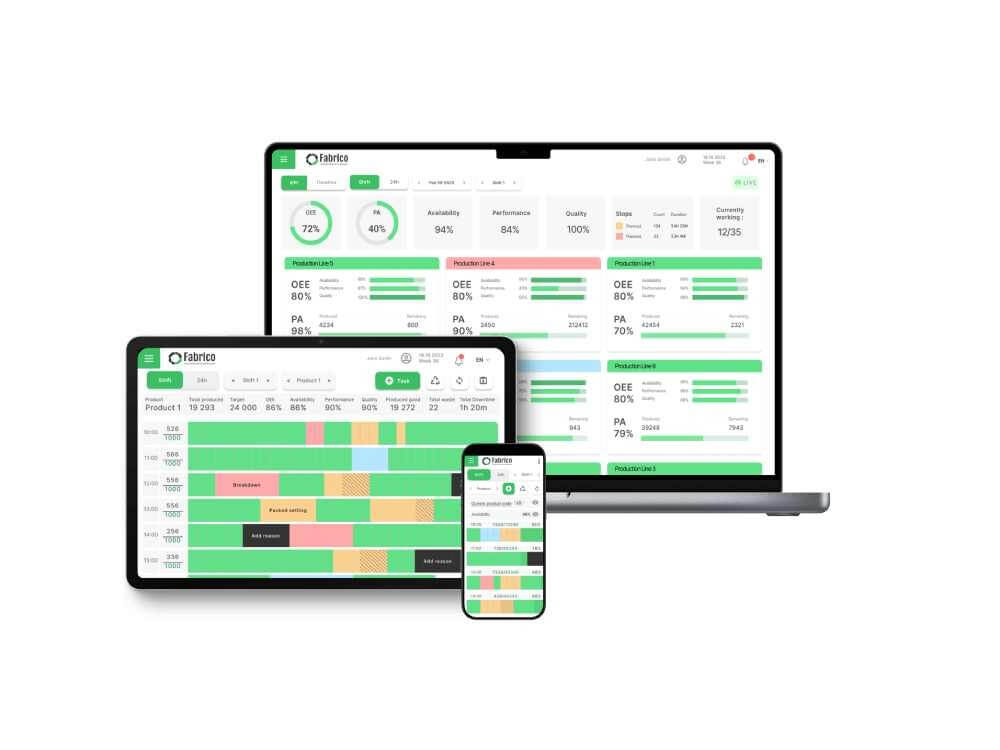
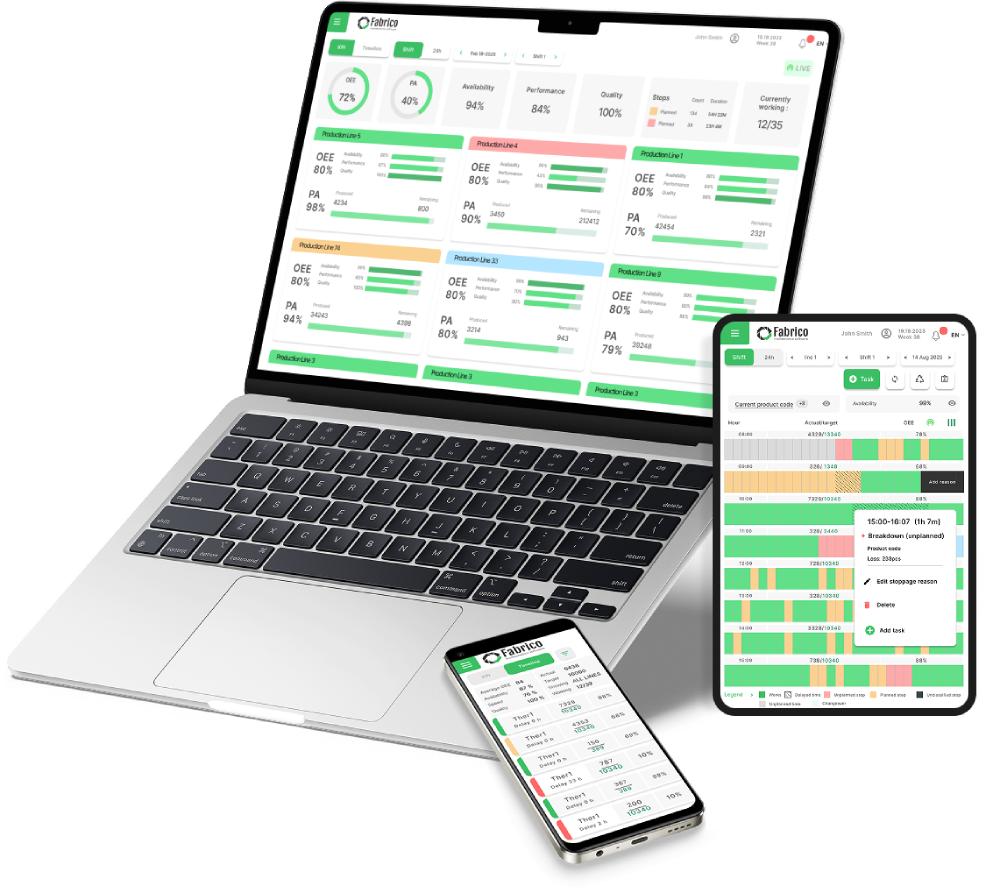
Comparison Matrix: Traditional Monitoring vs. Visual System of Action
| Capability |
Standard Machine Monitoring |
Siled OEE Dashboards |
Fabrico (System of Action) |
| Data Source |
PLC Signal Only |
Data + Manual Logs |
PLC + CV + Operator |
| Micro-stop RCA |
Guesswork |
Subjective |
Advanced (Visual Replay) |
| Response Trigger |
Visual Alert Only |
Emailed Report |
Automated Mobile WO |
| Maintenance Link |
None |
Via API (Complex) |
Native Integrated CMMS |
| Decision Latency |
High (Hours) |
Moderate |
Zero (Automated) |
| ROI Strategy |
Awareness |
Reporting |
Revenue Reclamation |
Dimension 3: Protecting the Value Fulcrum in High-Speed Lines
Sustainability requires moving from reactive "Firefighting" to a proactive reliability strategy.
Fabrico’s visual evidence allows you to find your plant's Value Fulcrum, the point where maintenance effort perfectly balances against revenue uptime.
By identifying "Bad Actor" assets through visual trends, you can move your team to Condition-Directed Tasks that prevent failures before they occur.
This shift reduces your Maintenance Cost per Unit and ensures your multi-million dollar assets reach their full residual value.
The Strategic ROI: ROI Today, Autonomy Tomorrow
For Paula (the Strategic Leader), the business case for Visual OEE is built on "Master Data."
By consolidating OEE signals and video proof into one platform, you are building the "Factory Brain" required for future optimizations.
This dataset is the essential foundation for the Fabrico Agent (AI Roadmap), which will eventually automate bottleneck analysis.
Stop guessing why your machines are stopping. Start seeing the truth with a System of Action.