If you want to diagnose a patient, you don't just look at them; you take an MRI.
In manufacturing, Value Stream Mapping (VSM) is that MRI.
Many Plant Managers look at their factory and see "Busyness." Machines are moving, forklifts are driving, and people are working. It looks productive.
But if you map the actual flow, you often find that a product spends 95% of its time sitting in a bin waiting, and only 5% of its time actually being transformed.
VSM is the only tool that exposes this reality. It connects the dots between the Customer Order, the Production Floor, and the Supplier.
Here is the strategic guide to creating and using a Value Stream Map to drive efficiency in 2026.
1. What is a Value Stream?
A Value Stream is the series of steps that occur to provide the product the customer needs.
It includes two flows:
-
Material Flow: The physical movement of the product (Raw Material -> Stamping -> Welding -> Shipping).
-
Information Flow: The signal that tells the product to move (Customer Order -> ERP -> Production Schedule -> Operator).
The Trap:
Most factories only map the Material Flow. They forget the Information Flow. If your schedule takes 3 days to get from the office to the floor, that is a 3-day delay before the machine even starts. You must map both.
2. Step 1: Select a Product Family
Do not try to map the entire factory at once. It is too complex.
Pick one "Product Family."
-
Definition: A group of products that pass through similar processing steps and over common equipment.
-
Strategy: Choose the product family with the highest volume or the highest strategic importance. This is where you will find the biggest ROI.
3. Step 2: Draw the "Current State Map"
This is a snapshot of reality today, warts and all.
Do not do this in a conference room. You must walk the floor (Gemba).
The Rules:
-
Walk Backwards: Start at Shipping (the Customer) and walk upstream to Receiving (the Supplier). This helps you see what is actually "pulled" by the customer versus what is "pushed" by the factory.
-
Collect the Data: At each process box, you need the "Data Box." This is critical.
-
Cycle Time (C/T): Time to make one part.
-
Changeover Time (C/O): Time to switch products.
-
Uptime (%): The reliability of the machine.
-
Scrap Rate (%): The quality of the process.
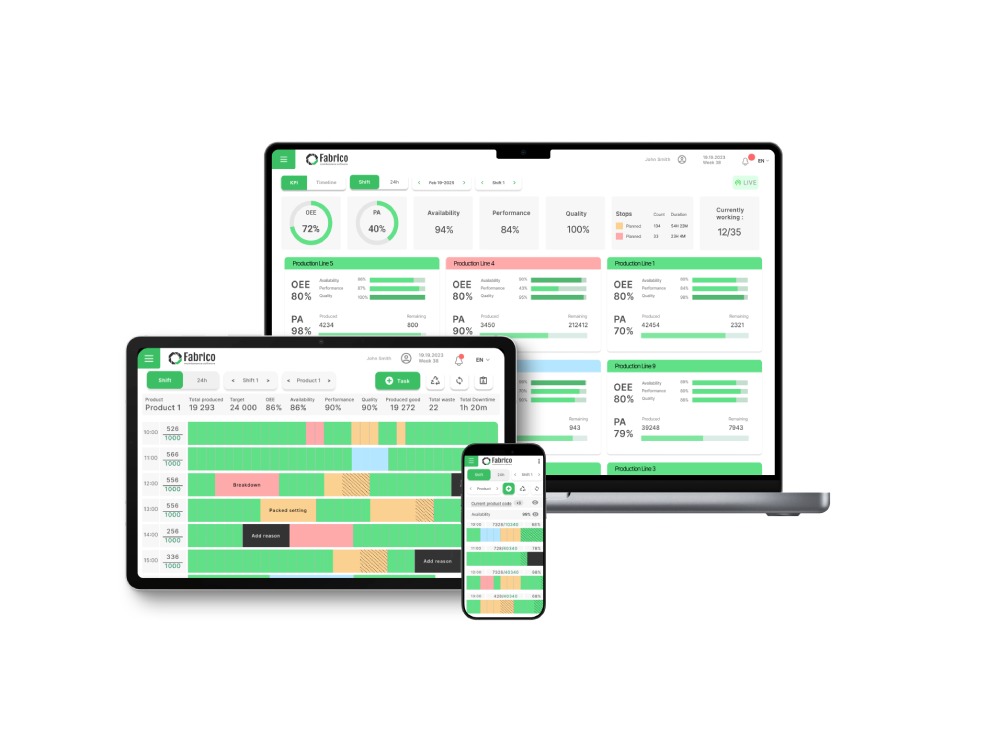
The Fabrico Advantage:
Traditionally, you stand there with a stopwatch for 10 cycles. This is inaccurate.
With a digital platform, you look at the tablet on the machine. It tells you the exact average Cycle Time and Uptime for the last 30 days. This makes your VSM mathematically accurate.
4. Step 3: Identify the Waste (The Analysis)
Now look at your map. Look for the "Triangles."
In VSM symbols, a Triangle represents Inventory (Work-In-Process).
The Shocking Truth:
You will likely find that your "Value Added Time" is minutes, while your "Lead Time" is weeks.
-
Example: 10 minutes of machining, but 3 days of waiting in a bin.
-
Strategy: Don't focus on making the machine faster (reducing the 10 minutes). Focus on eliminating the bin (reducing the 3 days).
5. Step 4: Draw the "Future State Map"
This is your goal. This is what the factory should look like.
Key Questions to Ask:
-
Takt Time: How fast does the customer buy? (e.g., 60 seconds).
-
Flow: Can we connect processes to eliminate the inventory triangles? (Continuous Flow).
-
Pull: Can we implement a Kanban system so we only produce what the next process needs?
-
Reliability: To link Process A and Process B, we need near-100% Uptime.
The Action Plan:
The gap between "Current State" and "Future State" becomes your project list.
Conclusion: From Static to Dynamic
A Value Stream Map is not a piece of art to hang on the wall. It is an action plan.
The biggest mistake is drawing the map and then walking away.
Use your digital operations platform to track progress. If your Future State requires 85% OEE, set that as the target in your dashboard.
By visualizing the flow, you stop optimizing islands (machines) and start optimizing the ocean (the business).