"Our OEE is 85%."
Whenever a Plant Manager hears this, they should be skeptical. If your OEE is truly 85%, you are running as efficiently as Toyota. You should have zero overtime, zero missed shipments, and record profits.
If you have 85% OEE but you are still expediting freight and working weekends, your number is a lie.
The obsession with the "World Class" benchmark (85%) has created a culture of Data Manipulation.
To keep corporate happy, teams massage the math. They exclude changeovers. They slow down the "Standard Rate." They stop the clock during breaks.
This makes the dashboard look green, but it blinds you to the opportunities for improvement.
Here is why you need to stop chasing the score and start chasing the truth—and how modern software forces honesty.
How Factories "Game" the System (and Lose Money)
1. The "Standard Rate" Sandbag
OEE Performance = (Total Count / Run Time) / Ideal Cycle Time.
-
The Cheat: If the machine is rated for 100 parts/minute, but you change the "Ideal Rate" in the system to 80 parts/minute, your OEE instantly jumps from 80% to 100%.
-
The Cost: You have accepted a 20% permanent loss in capacity just to make a chart look good.
-
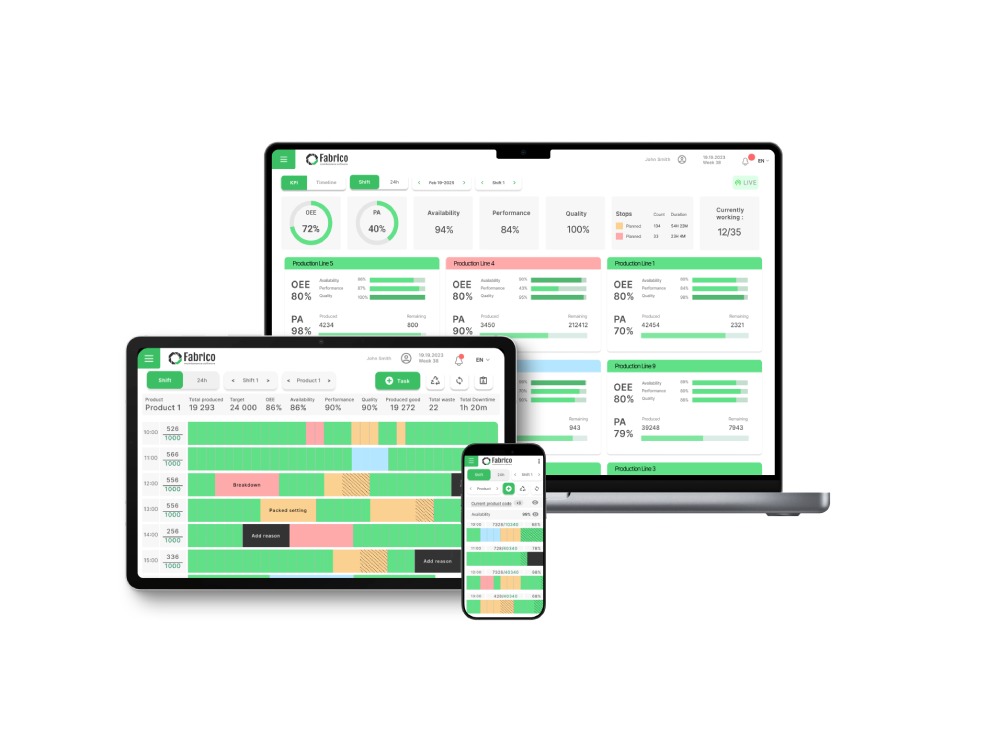
The Fabrico Fix: Fabrico pulls the Design Speed from the PLC or OEM specs. It highlights "Speed Loss" ruthlessly, showing you exactly how much revenue you are leaving on the table.
2. The "Planned Downtime" Loophole
OEE Availability = Run Time / Planned Production Time.
-
The Cheat: If you categorize every breakdown as "Planned Maintenance" or "Waiting for Material (Exempt)," it doesn't count against OEE.
-
The Cost: You ignore the root causes of the downtime because the data says "It wasn't our fault."
-
The Fabrico Fix: Fabrico tracks TEEP (Total Effective Equipment Performance). It looks at 24/7/365 capacity. It forces you to categorize stops accurately, exposing the "Not Scheduled" buckets that hide waste.
3. Ignoring the Micro-Stop
-
The Cheat: Filtering out stops under 2 minutes because "operators can't log them."
-
The Cost: In high-speed manufacturing, micro-stops often account for 50% of total efficiency loss. Ignoring them is like ignoring a leaking faucet because the drops are small.
-
The Fabrico Fix: Automated Capture. The system logs every 5-second stop. It shows the "Death by 1,000 Cuts" on the dashboard, forcing the team to address the sensor flickering or the rail misalignment.
The Power of the "Ugly" Number
The most profitable day in your factory is the day you admit your OEE is actually 45%.
Why? Because you can fix 45%. You cannot fix a fake 85%.
When you switch from manual logs (subjective) to Automated Data Collection (objective), your OEE will drop. This is good. It means you have turned on the lights.
Strategy: From Scorekeeping to Winning
-
Automate the Signal: Remove the human element from data collection. Connect Fabrico to the machine. Let the PLC count the cycles and the seconds.
-
Lock the Standards: Set the "Ideal Cycle Time" to the machine's nameplate speed, not the comfortable speed.
-
Trend > Absolute: Stop asking "What is the number?" Start asking "Is the trend line going up?" A plant moving from 40% to 45% is healthier than a plant stagnating at a fake 85%.
Conclusion: Embrace the Truth
Data integrity is the foundation of profit.
If you want a participation trophy, stick to Excel. If you want to find the hidden capacity to grow your business, you need the unbiased truth.
Use Fabrico to tell you the truth about your OEE.