Key takeaways
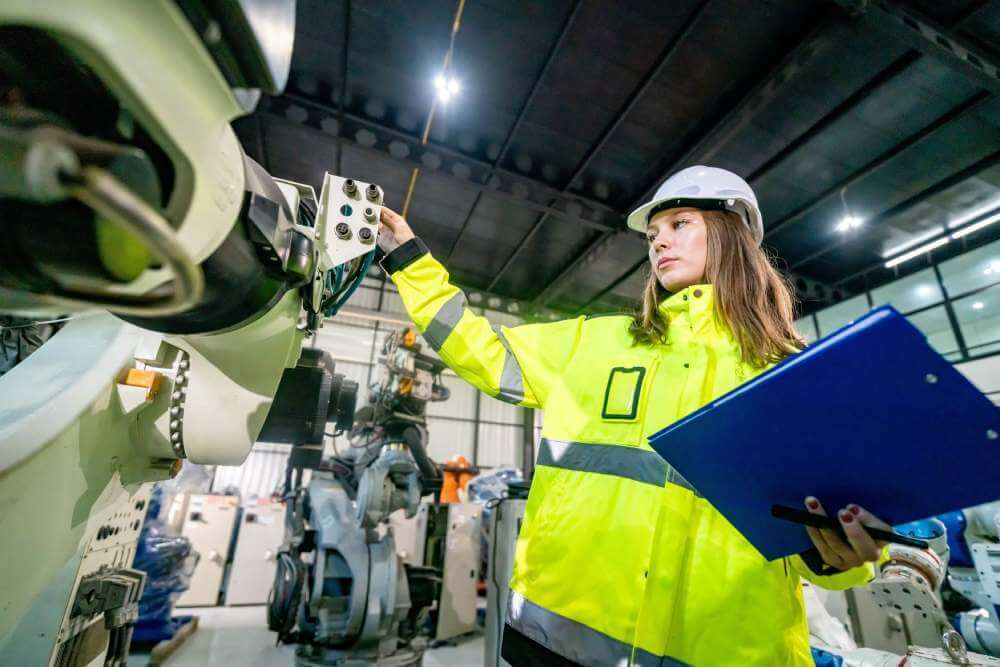
Visual management is the practice of designing the workplace so its status is obvious. A glance tells you whether a line is on target, where a problem is, whether tools are in place, and what should happen next, without a meeting or a query. The test is simple: could someone new walk onto the floor and tell what is normal and what is not, just by looking?
It works because humans process visual signals far faster than text or numbers buried in a system. A red marker, an empty shadow on a tool board, a production count falling behind a line on a chart, all register instantly.
The opposite of visual management is information locked in a system that people have to stop and retrieve. Visual management pushes the relevant status out to where the work is, so acting on it does not require a detour. That is the same instinct behind Andon (signal a problem at the spot) and shop floor management (a live view where the work happens).
Paper boards have a weakness: they are only as current as the last person who updated them, and they hold no history. Digital visual management puts the live numbers, OEE, downtime, target versus actual, on a screen on the floor, updated automatically, with the data also stored for analysis. The glanceability of a board, plus accuracy and a record. The key is to keep the floor display simple; the analysis depth lives behind it, not on the wall.
Fabrico turns the live state of each line, target versus actual, OEE, current stops and their causes, into a floor-ready view that updates automatically, so the board is always current and backed by stored data rather than a marker someone forgot to move. Because a visible problem can become a work order in the same system, the visual connects to a response instead of just displaying a red number. Fabrico is built and hosted in the EU with data residency in mind and is ISO 27001 certified. To put an always-current status view on your floor, book a demo.
For a practical next step, compare the leading options in our guide to the best shop floor management software.
Designing the workplace so its status is obvious at a glance, letting anyone distinguish normal from abnormal without asking or querying a system. Tools like shadow boards, floor markings, production boards, and Andon lights all make the state of work self-evident.
Because people read visual signals far faster than text or buried numbers, and because it puts information where the work is rather than in a report someone must retrieve. Problems become obvious immediately, and less time is lost asking and searching.
A board is only visual management if it is current and connected to a response. A stale board or a dashboard of forty unread metrics is just decoration. The visual must be simple, accurate, and tied to an expected action.
Digital boards stay current automatically and keep a history, which paper cannot. The trade-off is to keep the floor display simple and let the analysis live behind it. The goal is the same: glanceable status, now with accuracy and a record.