


 Login
 Blog
Visual Management: Making the Status of Work Obvious

Key takeaways
- Visual management in manufacturing puts the state of the work in plain view where the work is done, so a glance tells normal from abnormal and shows who should act.
- A board changes action when five conditions hold: a written standard, current information, a named owner with a response time, a place where the decision is made, and few signals.
- Digital visual management supplies currency and history from machine data; the standard, the owner and the choice of signals stay decisions for people.
- Worked example (sample figures): naming an owner and a response rule for the speed gap on a nappy line cuts slow running from 150 to 25 minutes a shift, worth EUR 456.17 of margin a shift and EUR 361,287 a year, if the nappies would sell.
- Start with one board: write its standard, check the age of its numbers, name its owners and remove the signals nobody used.
Visual management in manufacturing means making the state of production readable at the point of work: whether the line is on target, where a problem is and what should happen next, without a report or a meeting. Boards, floor markings, lights and line screens are its tools.
A question plant managers put is what separates a board teams use from wallpaper nobody looks at. The board itself decides little. Five conditions decide whether a visual signal changes what someone does in the shift: the board shows a defined standard, its information is current, each signal has a named owner and a response time, it sits where the decision is made, and it carries few enough signals to read at a glance.
What visual management means in manufacturing
Visual management is the practice of designing the workplace so its status is obvious. A glance tells you whether a line is on target, where a problem is, whether tools are in place, and what should happen next, without a meeting or a query. The test is simple: could someone new walk onto the floor and tell what is normal and what is not, just by looking?
Research gives the principle an order. In a literature synthesis in the Journal of Manufacturing Technology Management, Tezel, Koskela and Tzortzopoulos (2016) place visual standards and specifications among the base layers of a visual workplace: the base sets the standards for the more operational tools built on top, such as visual signals and visual controls. Making processes visible, the authors add, is expected to make deviations easier to identify. For a plant manager the order matters, because a red mark means nothing until someone has written down what green looks like.
Safety law applies the same logic to the oldest visual indicators in any plant. Council Directive 92/58/EEC on safety and health signs at work defines a safety colour as a colour to which a specific meaning is assigned, and names a signboard, a colour, an illuminated sign or acoustic signal, verbal communication and hand signals as the ways to give safety information. The meaning comes first; the colour carries it.
On a production line, a central visual is the count against the plan, and a board is only as honest as that count. OEE software builds the count from data that comes from the machine's PLC or an IoT device with sensors on the machines you connect; the reason for a stop is entered at the line by the person running it, so the board at the line and the record behind it hold one set of numbers. The video below walks through that loop.
What you see: a shift timeline, unclassified time waiting for a reason, and the operator's line-down screen, on sample lines. Book a demo.
Plays from YouTube. Google may set cookies when you press play. Privacy policy.
The principle: bring information to the work
The opposite of visual management is information locked in a system that people have to stop and retrieve. Visual management pushes the relevant status out to where the work is, so acting on it does not require a detour. Fenza, Loia and Nota, writing in Sensors in 2021 on visual management patterns for Industry 4.0, describe the reach of the idea: in manufacturing, visual management is made possible by communication devices that return data about the state of a workplace, a machine, a cell or production line, a process, a department or the whole factory. The same instinct sits behind andon, a method for signalling a problem at the spot, and shop floor management, a live view where the work happens.
Board or wallpaper: five conditions that make a visual signal change action
A board earns its place when a signal on it leads someone to act during the shift. Five conditions decide whether that happens. Each one is backed by research on visual management and daily management, and each can be checked on a walk past the board.
1. A standard. The board says what normal is, so abnormal needs no interpretation: a target rate, a limit, a colour with a written meaning. The Tezel synthesis puts standards in the base layer, and the safety-sign directive writes the assigned meaning into its definition of a safety colour. A red figure with no written threshold starts a debate, not an action.
2. Currency. The information is young enough to act on within the shift. Nilsson and colleagues (2019) compared two manufacturing companies, one running its shop floor meetings on analogue boards and one on digital boards. With the analogue boards, the responsible lean manager spent about a quarter of an hour collecting the data for each KPI by hand, with pen, paper and stopwatch. In a 2024 Chalmers master's thesis by Ek and Sandell on daily management at a Swedish Match production site, most of the numbers in the OEE report used at the daily meeting were for the previous day, and only the day shift column was filled in. A board that shows yesterday can start a discussion; it cannot change today's shift.
3. An owner and a response time. Each signal names the person who responds and the time they have to do it. The same thesis, summarising Mann (2014), describes daily accountability: at the meeting, every task due that day is reviewed; a finished task gets a green dot, an unfinished one a red dot, and the supervisor looks into the cause. A gap that everyone can see and nobody owns stays open.
4. Proximity. The signal sits where the decision is made, in sight of the people who can act on it. Mann, as the thesis reports, places the task board near the work area, because the staff then keep seeing the task, its due date and whether it was done on time. An accurate screen in an office can still change nothing at the line.
5. Few signals. The board carries what a team can read and act on at a glance. Tezel and colleagues warn against displaying too much information, beyond the capabilities of recipients, and, citing Eppler and Mengis (2004), link information overload to misapprehension, stress and poor performance. In a 2019 Instituto Superior Técnico case study of the daily production meeting in a paper production unit, where the board was still on paper with static information, choosing which KPIs the new digital board would show was one of the main concerns.
The table scores a typical paper board, updated by hand, and a typical digital board fed by machine data against the five conditions, plus the history each one keeps.
| Condition | Paper board, updated by hand | Digital board fed by machine data | Sources |
|---|---|---|---|
| A standard | Team decides: targets and limits can be printed on the board | Team decides: the screen shows the targets and thresholds someone set | Tezel et al. 2016; Directive 92/58/EEC |
| Currency | Weak: as old as the last update; data collected by hand, about 15 minutes for each KPI in one case | Strong for machine data: counts arrive during the shift; typed inputs still wait for a person | Nilsson et al. 2019; Ek and Sandell 2024 |
| An owner and a response time | Team decides: names, due dates and red or green dots on the board | Team decides: a rule can notify a named person, but people choose that person | Ek and Sandell 2024, after Mann (2014) |
| Proximity | Strong where it hangs, for the people who attend in person | Strong at the line and for managers anywhere | Ek and Sandell 2024, after Mann (2014) and Meissner et al. (2018) |
| Few signals | Strong: the edge of the board limits what fits | Weak unless chosen: a screen has no edge | Tezel et al. 2016; Ek and Sandell 2024, after Parry and Turner (2007); Matos 2019 |
| History (a by-product, not a condition) | Weak: archiving paper is hard; in one case the archive sat on one manager's phone and notebook | Strong: stored in the system and comparable across shifts | Ek and Sandell 2024; Nilsson et al. 2019 |
Where digital visual management helps, and where it does not. Read the table by row. A digital board wins currency and history: counts arrive from the machine during the shift and stay stored for the next comparison, while analogue boards, the thesis notes, can make archiving difficult. It ties on the standard and the owner, because both are decisions people make; no screen picks the target rate or the person who answers a gap. It can lose on few signals: a paper board runs out of space, a screen never does. Parry and Turner (2007), cited in the thesis, argue that the limited space of an analogue board reduces the risk of showing information that adds no value, and Mann's view, as reported there, is that where people can attend in person, the analogue accountability board works better. The thesis also notes a cost of automation: employees who no longer collect the numbers may identify less with them.
Shop floor visual management examples
The forms below are visual indicators found on shop floors. Each one counts as visual management while it meets the five conditions.
- Shadow boards: an outline for every tool at its point of use, so a missing tool shows before the job needs it; where 5S ends and visual management begins is set out in 5S vs visual management.
- Floor markings: taped zones for materials, walkways and work in process; an empty or overfull WIP lane shows a flow problem before the next step runs dry.
- Production boards: target versus actual by hour, with the reason for each missed hour and the name of whoever owns the action.
- Andon lights and kanban cards: status and demand signals across the floor; andon is the method of signalling a problem where it occurs.
- Safety signs and colours: prohibition, warning, mandatory and emergency signs, each with a meaning the EU safety-sign directive defines in advance.
- Line screens: the live count against target, OEE for the shift and the reason for the current stop, at the end of the line.
A shadow board where tools have no agreed home, or a WIP lane with no limit painted on it, fails the first condition however neat it looks.
Digital visual management: what changes when the board becomes a screen
Digital visual management keeps the principle and changes the supply of information: the board's numbers come from machines and systems instead of a marker, and they are stored. The Industry 4.0 paper by Fenza and colleagues lists limits of existing visual management solutions that its approach is designed to overcome, among them difficulty sharing data between multiple roles, no access to the data the machines themselves generate, and difficulty implementing real-time reactive behaviour.
The change shows in the data work. In the digital case Nilsson and colleagues studied, most of the quantitative data was collected automatically through the ERP system, some mostly qualitative data was still updated by hand, and the daily collection took no more than 15 minutes. In the analogue case each KPI took about that long, and the graphs were made in Excel and printed. The digital company also archived its data in its IT system. Digital boards travel too: the Chalmers thesis, citing Meissner et al. (2018), notes that managers can see the information from anywhere and support their operators from there.
Keep the floor display simple and let the analysis live behind it, not on the wall. When the board moves to a screen, decide whether the area needs a meeting tool, measured losses or both; the comparison of tier board software and OEE data covers that choice, and the list of visual factory software compares tools for the screen itself.
Worked example: slow running on a nappy line, with and without an owner
Sample figures for illustration only. A hygiene products plant makes baby nappies on a high-speed converting line. This line limits the plant's output, and every extra nappy it makes can be sold. Three shifts run on each of 22 working days a month, 66 shifts in all, with 400 minutes of run time a shift. The standard rate for the current size is 800 nappies a minute.
The board is current. A screen at the end of the line shows the target and the actual count for the hour, fed from the machine. After a reel splice or a change of raw material, the operator lowers the speed to 745 nappies a minute to keep the web steady, and the line stays there. Everyone can see the actual falling behind the target, but nobody owns the gap: the operator treats line speed as the shift lead's call, and the shift lead reviews the screen at the end of the shift. Over the sample month, the line runs below its standard rate for 150 minutes a shift on average.
The plant then adds two entries to the board. The line leader owns the speed gap. The response rule: when the screen shows the line below its standard rate, the line leader comes to the line within 10 minutes and either restores the standard rate or records why the line must run slower. In the sample month the speed went back to standard each time, and slow running fell to 25 minutes a shift, the minutes before the line leader arrived and the speed recovered.
| A shift | Before: no owner | After: owner and rule |
|---|---|---|
| Minutes below the standard rate | 150 | 25 |
| Nappies short of standard (55 a minute) | 8,250 | 1,375 |
| Nappies counted (ideal 320,000) | 311,750 | 318,625 |
| Performance, counting slow running only | 97.42% | 99.57% |
Each minute below standard costs 55 nappies, the difference between 800 and 745. Cutting slow running from 150 to 25 minutes wins back 125 x 55 = 6,875 nappies a shift. In OEE terms slow running is a performance loss: against an ideal of 400 x 800 = 320,000 nappies in the run time, performance rises from 97.42% to 99.57%, or 6,875 divided by 320,000 = 2.15 points, with availability and quality unchanged; OEE performance covers the factor in depth. The screen did not change. The owner and the rule did.
In euros. Price the nappies with a sample of EUR 0.13 a nappy ex works and a gross margin of 51.04%, the figure NYU Stern lists for US household products companies (110 firms, January 2026 data). One nappy then carries EUR 0.13 x 51.04% = EUR 0.066352 of gross margin, and the 6,875 nappies are worth 6,875 x EUR 0.066352 = EUR 456.17 a shift. Per month (66 shifts) and per year (12 x 66 = 792 shifts):
| Nappy line | A shift | A month (66 shifts) | A year (792 shifts) |
|---|---|---|---|
| Nappies won back | 6,875 | 453,750 | 5,445,000 |
| Gross margin at stake | EUR 456.17 | EUR 30,107.22 | EUR 361,286.64 |
The margin is real money if the extra nappies would sell and the line stays the constraint. If the line had spare capacity, the lost minutes would cost energy and wages rather than sales. The 51.04% averages 110 US companies; use your own SKU margin when you have it. Currency still matters here: with a paper board updated on the hour, the same rule could fire only when the hour's figure was written, so a gap that began just after an update could run for most of an hour before anyone saw it.
Four signs a board has turned into wallpaper
Wallpaper, in the plant manager's question, is a board people walk past without acting. Four signs give it away on a walk through the area, and each points to the condition that failed.
- Yesterday's numbers. The newest figure on the board was written before the shift began. Fix the currency: feed the board from the machine, or update it at fixed times and print the time of the last update on the board.
- Red without a rule. A figure is marked red, but nothing on the board says what threshold made it red or what should happen next. Fix the standard: write the limit and the expected response next to the signal.
- Actions nobody owns. Open actions carry no name or due date, or the same red mark sits there for days. Fix the ownership: one name and one response time per signal, reviewed at the daily meeting.
- Forty metrics on one screen. Nobody can say which figure matters this hour. Fix the selection: remove every signal nobody acted on in the last two weeks, and keep the analysis behind the screen.
Paper board, digital board or OEE screen: which fits each area
The five conditions do not pick a technology; the area does. Choose by who reads the board, where they stand and how fast the loss it shows can grow.
| Option | Where it fits | Rough effort (estimate) | Chosen by | Watch for |
|---|---|---|---|---|
| Paper or whiteboard | A team area with a daily meeting at the board, people on site, a handful of indicators | 4 to 8 hours to design and hang one board, then a few minutes a day to update it | Team leader or shift manager | Print the time of the last update; keep the sheets you will want to compare |
| Digital meeting board, typed and imported data | Tier meetings across areas or sites, where participants are not all in one place | 8 to 24 hours to build the first board, plus the data entry | CI engineer with the plant manager | Typed numbers still trail the line; set a limit on the KPIs, because the screen has no edge |
| Live OEE screen at the line, fed by machine data | Constraint or high-speed lines where losses inside the shift matter: slow running, short stops, waiting | Plant time of 10 to 30 hours per line to connect it, set standard rates and stop reasons and write the notification rules, plus the vendor's work | Plant manager with the CI engineer | Agree standard rates and the stop reason list first, and name the owner of each notification rule |
| Both: live screen at the line, paper accountability board at the meeting point | Plants where the line needs live counts and the team meets in person | The sum of the two | Shift manager with the plant manager | One source for each number, so the screen and the board never disagree |
The effort figures are estimates in plant-side hours for one area or line; they exclude licences and equipment, whose prices differ from vendor to vendor. On the worked example, any option is judged the same way: minutes below standard before and after, times the margin those minutes carry.
Who picks which. The shift manager owns the meeting, so a paper or digital meeting board is that person's call. The plant manager decides where a line needs live counts, because that decision commits budget and plant time. The CI engineer measures the loss before and after, and should be the one to say whether a screen changed a number.
Questions to ask before choosing:
- Which decision does this board support, and who makes it?
- How old is the oldest number on it when someone reads it?
- Where is normal written, and what threshold turns a signal red?
- Who owns each signal, and within what time do they respond?
- Can the person who must act see it from where they work?
- Which signal could be removed without anyone missing it?
Who owns which condition: plant manager, shift manager and CI engineer
The five conditions are kept by people, not by the board. The table gives each role the conditions it owns and a first move.
| Role | Owns | This week | This quarter |
|---|---|---|---|
| Plant manager | Owners and few signals | Ask each area for its board's owners and response times, and strike one signal per board that nobody acted on | Choose paper, digital or a live OEE screen area by area, and go through the owners' response times with them once a month |
| Shift manager | The standard and proximity | Write the standard rate and the red threshold on the constraint line's board, and move the board to where the line leader works | Run the shift handover from the board and review open actions by their due date |
| CI engineer | Currency and the measurement | Note the age of each number when the board is read, and time the minutes below standard rate for a week | Price the gap at the line's margin, then repeat the timing once the owner and the rule are in place |
Five steps for this week, on one board:
- Pick the board on the line that limits the plant's output.
- Write the standard next to each signal: the target, the limit and what happens when it is crossed.
- Record the time of the oldest number on the board each time the shift lead reads it.
- Name one owner and one response time for each signal, on the board.
- Price the gap: minutes below standard x units a minute x price x margin for a shift, times the shifts in a month, and 12 times that for a year.
How Fabrico fits
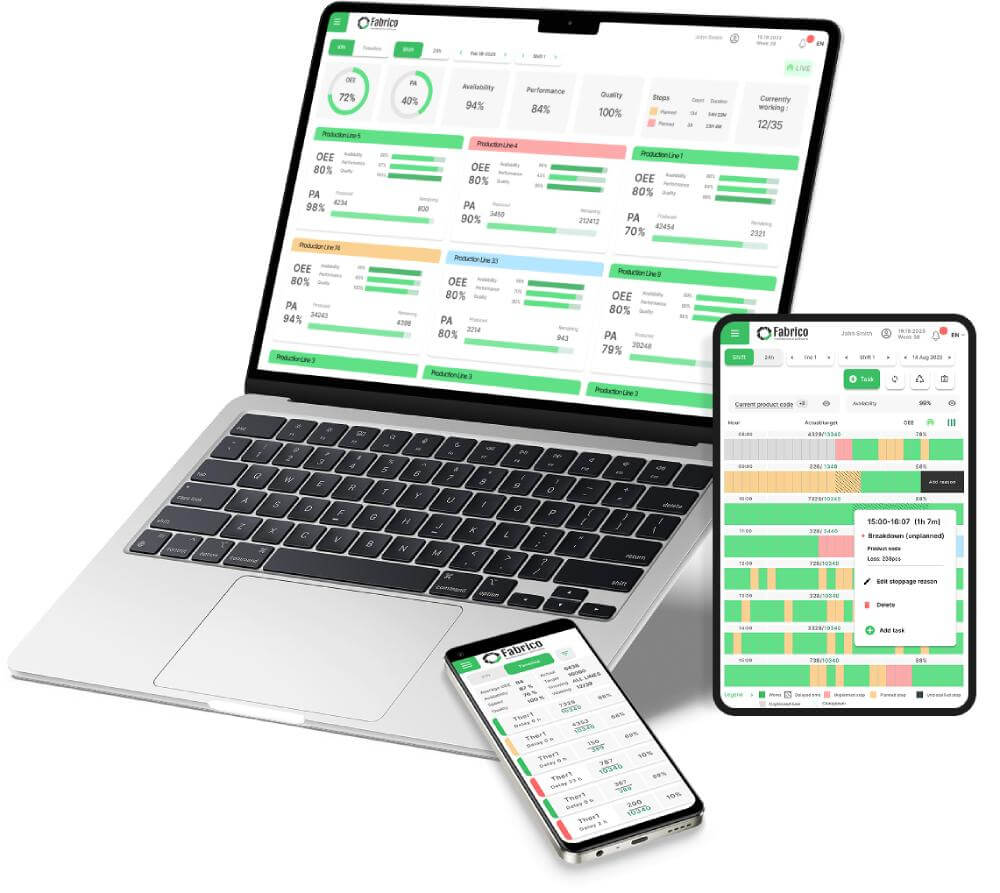
Fabrico pairs live OEE with a light MES. Of the five conditions it supplies the one a screen can supply, currency, and it keeps the history. Its data comes from the machine's PLC or an IoT device with sensors on the machines you connect; stop reasons come from the operators at the line. On the floor the view is a live OEE dashboard on a floor screen or tablet, with notifications by rule; the dashboard carries real-time OEE (availability x performance x quality) per line and shift, with micro-stop detection and the six big losses made visible.
The other conditions stay with the plant. The people who run the line set the standard rates and the stop reason list. Alerts go out as push, in-app and email notifications with smart rules; the owner named on the board can be the person a rule notifies. With the selling price and margin of each SKU entered, losses are priced in money. A speed gap like the one in the worked example can then be read in euros as well as in OEE points, and OEE stays the production measure.
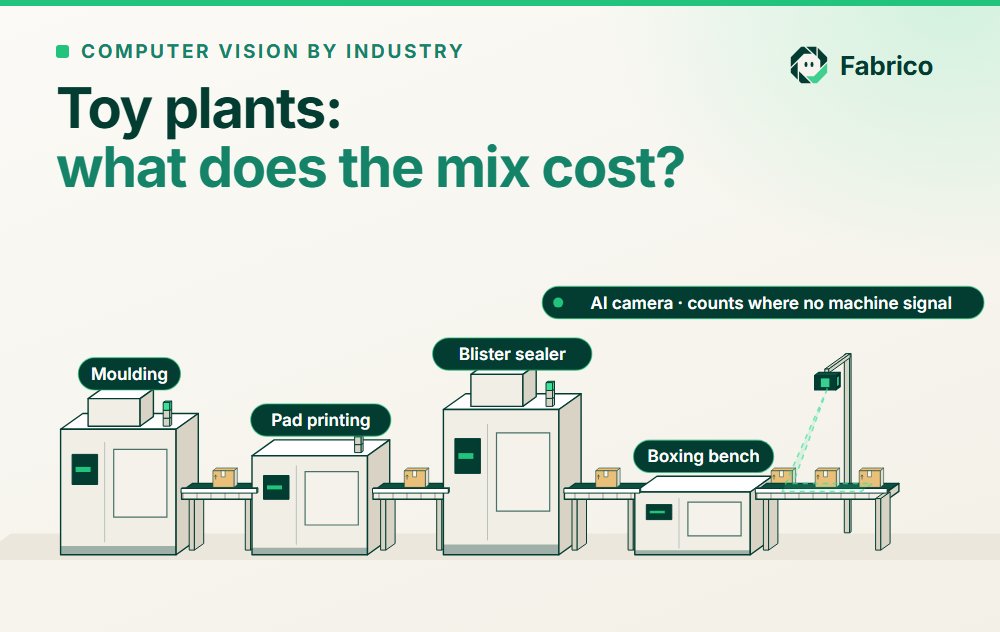
A packing table or an older machine may give no signal at all; there the camera add-on counts the units produced. Where the camera add-on covers the station, the video for the minute of a stop can be opened from the shift timeline, streamed on request and not stored in Fabrico. Fabrico is certified to ISO/IEC 27001.
For the measures behind a board, see OEE explained and manufacturing KPIs. To see the live OEE dashboard and its notification rules on sample lines, book a demo.
Frequently asked questions
What is visual management in manufacturing?
Visual management in manufacturing puts the status of each line, cell and workstation in plain view where people work, so anyone at the line can tell normal from abnormal and knows who should act. Shadow boards, floor markings, target versus actual boards, andon lights and line screens are its tools. A visual signal works when five conditions hold: a written standard, current information, a named owner with a response time, a place where the decision is made and few signals.
What are visual indicators in the workplace?
Visual indicators are signs, colours, markings, lights and displays that show the state of the workplace or what to do without words: safety signs, aisle and floor markings, tool outlines, status lights, kanban cards and target versus actual boards or screens. EU Directive 92/58/EEC defines a safety colour as a colour to which a specific meaning is assigned. Production indicators need the same: a meaning agreed before the signal goes up.
What separates a board teams use from wallpaper nobody looks at?
A board teams use changes what someone does during the shift. That happens when it shows a standard, so abnormal is plain; its numbers are current; each signal has a named owner and a response time; it hangs where the decision is made; and it carries few signals. A board that misses any of these is read late or not at all. A quick test: ask who acted on the board's last red mark, and when.
What is digital visual management?
Digital visual management shows the board's signals on screens fed by machines and systems instead of markers, and stores them. It makes the information current and keeps a history across shifts. It does not write the standard, name the owner or choose which signals matter; those stay decisions for the people who run the area, and a screen with no edge needs a deliberate limit on its KPIs.
What are examples of shop floor visual management?
Shadow boards with an outline for each tool, taped floor zones for materials and work in process, hourly target versus actual boards with the reason for each missed hour, andon lights and kanban cards, safety signs, and a line screen with the live count, OEE and the reason for the current stop. Each one counts as visual management while it meets the five conditions; a tool outline nobody restocks is a picture on a wall.
What is the difference between visual management and a visual factory?
Visual management is the principle: put the state of the work in plain view at the point of use. A visual factory is that principle applied to a whole plant as one system of signals, from tool boards to the daily tier meeting.
Related articles




Latest from our blog


Real Fabrico tiles, sample data.