


 Login
 Blog
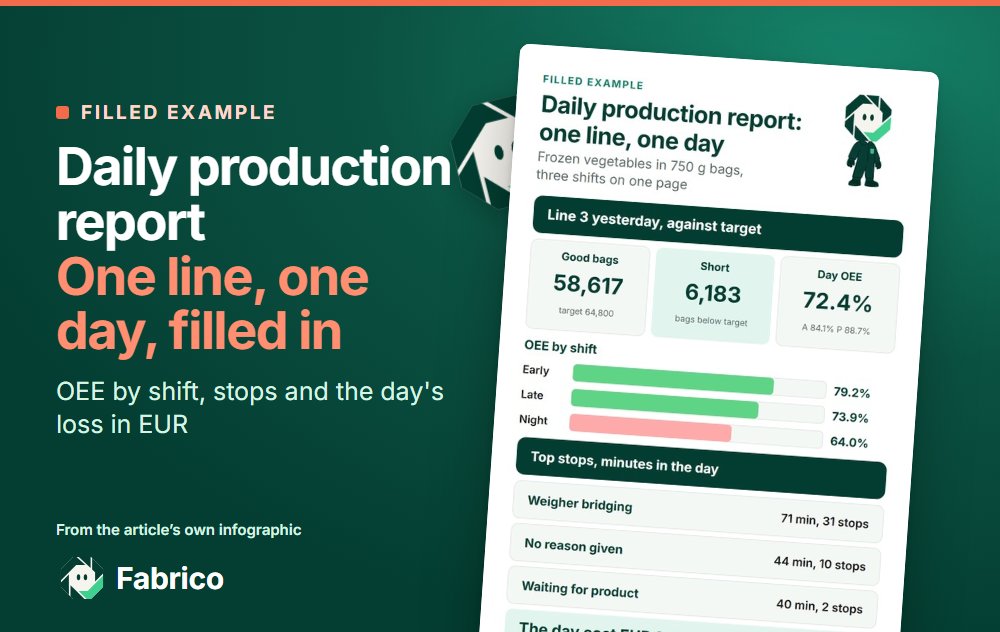
Daily Production Report: A Filled Example, Template and Format

In short: a daily production report is one page per line that shows what yesterday made against target, where the time went, what the gap cost and who acts on it today. A useful daily production report template is not an empty grid: below is a filled daily production report example for one frozen vegetable packing line, then the daily production report format rules, the field owners, the Excel formulas and the point where a spreadsheet stops being enough.
- Keep the fields that lead to a decision: target, good output by hour, stops with reasons, rejects, OEE by shift, money, actions.
- One page, a fixed order, read in under ten minutes at the daily meeting.
- Every field has an owner who fills it while the shift is still on.
- In the sample day the line made 6,183 bags fewer than target: EUR 2,541.54 lost, and EUR 304,985 a year if half of it is recovered.
Search for a daily production report format for the manufacturing industry and you get blank tables, in Excel, Word or a form app, with thirty columns and a signature box. Nobody can tell from a blank grid which numbers matter, so plants copy all thirty and the report becomes a page that takes an hour to fill and two minutes to ignore.
This guide starts from the other end: one line, one day, filled in. The line packs frozen vegetables into 750 g bags at a plant in Germany, the largest importer of frozen vegetables in Europe according to the CBI market study for frozen vegetables. The numbers are sample figures, but they are carried through to OEE by shift and to the money the day cost, and the template at the end holds the same fields.
A daily production report example: one frozen vegetable line, one day
Sample figures for illustration only. Line 3 runs a multihead weigher, a vertical bagger, a checkweigher, a case packer and a palletiser. It works three 8-hour shifts with a 30-minute break each, so planned production time is 3 x 450 = 1,350 minutes. The bagger's ideal rate on these products is 60 bags a minute. The plan sets the target at 48 good bags a minute of planned time, 64,800 for the day. A crew of 4 runs the line on each shift. The early shift changes over from mixed vegetables to garden peas.
Block 1: the day against target, by shift.
| Shift | Planned min | Stop min | Run min | Bags packed | Rejects | Good bags | Target | Gap | Availability | Performance | Quality | OEE |
|---|---|---|---|---|---|---|---|---|---|---|---|---|
| Early | 450 | 45 | 405 | 21,870 | 481 | 21,389 | 21,600 | 211 | 90.0% | 90.0% | 97.8% | 79.2% |
| Late | 450 | 65 | 385 | 20,558 | 617 | 19,941 | 21,600 | 1,659 | 85.6% | 89.0% | 97.0% | 73.9% |
| Night | 450 | 105 | 345 | 18,009 | 722 | 17,287 | 21,600 | 4,313 | 76.7% | 87.0% | 96.0% | 64.0% |
| Day | 1,350 | 215 | 1,135 | 60,437 | 1,820 | 58,617 | 64,800 | 6,183 | 84.1% | 88.7% | 97.0% | 72.4% |
The arithmetic for the night shift, the weakest of the three: availability is 345 run minutes of 450 planned, 76.7%. Performance is 18,009 bags packed against 345 x 60 = 20,700 at ideal rate, 87.0%. Quality is 17,287 good of 18,009, 96.0%. OEE is 76.7% x 87.0% x 96.0% = 64.0%, and the check is 17,287 good bags / (450 x 60) = 64.0%. The day's OEE comes from the summed minutes and counts: 58,617 / (1,350 x 60) = 72.4%.
Block 2: good output against target, hour by hour. Cells show good bags / target. The break hour has a target of 1,440.
| Early | Good / target | Late | Good / target | Night | Good / target |
|---|---|---|---|---|---|
| 06:00 | 3,063 / 2,880 | 14:00 | 2,745 / 2,880 | 22:00 | 2,856 / 2,880 |
| 07:00 | 2,852 / 2,880 | 15:00 | 2,953 / 2,880 | 23:00 | 2,656 / 2,880 |
| 08:00 | 3,063 / 2,880 | 16:00 | 2,641 / 2,880 | 00:00 | 1,553 / 2,880 |
| 09:00 | 2,007 / 2,880 | 17:00 | 2,900 / 2,880 | 01:00 | 2,756 / 2,880 |
| 10:00 | 1,426 / 1,440 | 18:00 | 1,399 / 1,440 | 02:00 | 1,203 / 1,440 |
| 11:00 | 3,010 / 2,880 | 19:00 | 2,590 / 2,880 | 03:00 | 2,054 / 2,880 |
| 12:00 | 2,905 / 2,880 | 20:00 | 2,745 / 2,880 | 04:00 | 2,205 / 2,880 |
| 13:00 | 3,063 / 2,880 | 21:00 | 1,968 / 2,880 | 05:00 | 2,004 / 2,880 |
Block 3: stops with reasons. Minutes and stop counts by shift, sorted by minutes for the day.
| Reason | Early | Late | Night | Day |
|---|---|---|---|---|
| Weigher bridging: frozen clumps on the multihead weigher | 14 min (7) | 26 min (11) | 31 min (13) | 71 min (31) |
| Other (no reason given) | 19 min (4) | 25 min (6) | 44 min (10) | |
| Waiting for product from the cold store | 40 min (2) | 40 min (2) | ||
| Film reel change and splice at the bagger | 9 min (3) | 8 min (3) | 9 min (3) | 26 min (9) |
| Changeover, mixed vegetables to garden peas | 22 min (1) | 22 min (1) | ||
| Case packer jam | 12 min (5) | 12 min (5) | ||
| Stop time, all reasons | 45 min | 65 min | 105 min | 215 min |
Three things stand out before anyone reads further. Weigher bridging, frozen product clumping on the weigher, cost 71 minutes in 31 short stops and rose shift by shift. The night shift waited 40 minutes for product from the cold store, a supply loss the line crew cannot fix alone. And 44 minutes, 20.5% of all stop time, have no reason, 19 of them in the late shift's last hour.
Block 4: quality and giveaway. The checkweigher rejected 1,820 bags, 3.0% of the day, rising from 2.2% on the early shift to 4.0% at night. Its mean fill was 756.8 g, 757.6 g and 758.1 g by shift, against a set point of 755 g and a declared 750 g. Why a frozen vegetable packer runs above the declared weight at all, and why the drift above the set point belongs on the daily page, is the subject of the next section.
Block 5: actions for today.
- Weigher bridging, 71 minutes: the process engineer checks product temperature at the weigher infeed on the late and night shifts. Due Thursday.
- Waiting for product, 40 minutes: the cold store lead and the night shift lead agree when the next pallets are called. Due tonight.
- Stops without a reason, 44 minutes: the line lead goes through them with the late and night operators before 10:00, and the list of reasons gets the missing entries. Due today.
What the day cost: the loss in EUR
A daily production report that stops at OEE leaves the meeting to guess how much the gap matters. Two sourced anchors turn it into money. Labour is priced at the Eurostat 2025 labour cost level for manufacturing in Germany, EUR 49.5 an hour (dataset lc_lci_lev, updated 23 April 2026). Margin comes from the NYU Stern margins by industry dataset (Aswath Damodaran, data as of January 2026), where 78 U.S. food processing firms show a gross margin of 23.23% and a cost of goods sold of 76.77% of sales. The bag price, EUR 1.60 ex works, is a sample; use your own price and margin when you have them.
The insider line: giveaway. A 750 g bag is sold under the average system. The UK packaged goods guidance on GOV.UK sets three packers' rules: the contents must not be less on average than the nominal quantity, the proportion of packs short by more than the tolerable negative error must stay below a set level, and no pack may be short by twice that error. The Office for Product Safety and Standards guide to the 2006 packaged goods regulations puts the tolerable negative error at 15 g for packs from 500 to 1,000 g, and asks packers on checkweigher lines to check that the set points are appropriate. So the line runs above 750 g on purpose, here with a set point of 755 g. The weigh pattern of frozen product is lumpy, and the mean fill drifts up as clumps form. The drift above the set point is product given away for nothing, and it never shows in OEE: a bag with 758.1 g in it is a good bag.
| Loss in the sample day | Calculation | EUR |
|---|---|---|
| Margin on bags not made (line sold out) | 6,183 bags x EUR 1.60 x 23.23% | 2,298.10 |
| Make-up time instead (line has spare capacity) | 6,183 / 48 a minute = 128.8 min x 4 people x EUR 49.5 / 60 | 425.08 |
| Giveaway above the set point | 148,645 g (148.6 kg) x EUR 1.60 / 750 g x 76.77% | 243.44 |
| All giveaway above 750 g, for scale | 450,830 g (450.8 kg) at the same cost a gram | 738.35 |
| Paid crew time during stops without a reason | 44 min x 4 people x EUR 49.5 / 60 | 145.20 |
| The day, sold-out view | Margin on bags not made + giveaway above the set point | 2,541.54 |
| The day, spare-capacity view | Make-up time + giveaway above the set point | 668.53 |
The first two rows are two views of one loss, not a sum: the margin view applies when every bag sells, the make-up view when the line can catch up on another shift. The giveaway rows use the sector's cost of goods as the cost of a gram of product, which includes more than vegetables and film, so treat them as a ceiling. The crew time during unexplained stops is already inside the gap; it is on the page to show what a missing reason costs, not to be added.
| Case | Share of the day's loss recovered | Sold-out view, a year | Spare-capacity view, a year |
|---|---|---|---|
| Low | 25% | EUR 152,493 | EUR 40,112 |
| Base | 50% | EUR 304,985 | EUR 80,223 |
| High | 100% | EUR 609,970 | EUR 160,446 |
The year assumes 240 packing days, 20 a month. Packing from the cold store runs through the year even where freezing follows the harvest, but one Tuesday is not a year: before quoting the figure, average the gap and the giveaway over 20 of your own days. The base case assumes the actions recover half of the day's loss, not all of it, because the target already allows for normal stops and the cold store wait has an owner outside the line. Even the base case on the spare-capacity view, EUR 80,223 a year, is more than the people cost of any reporting route in the comparison further down.
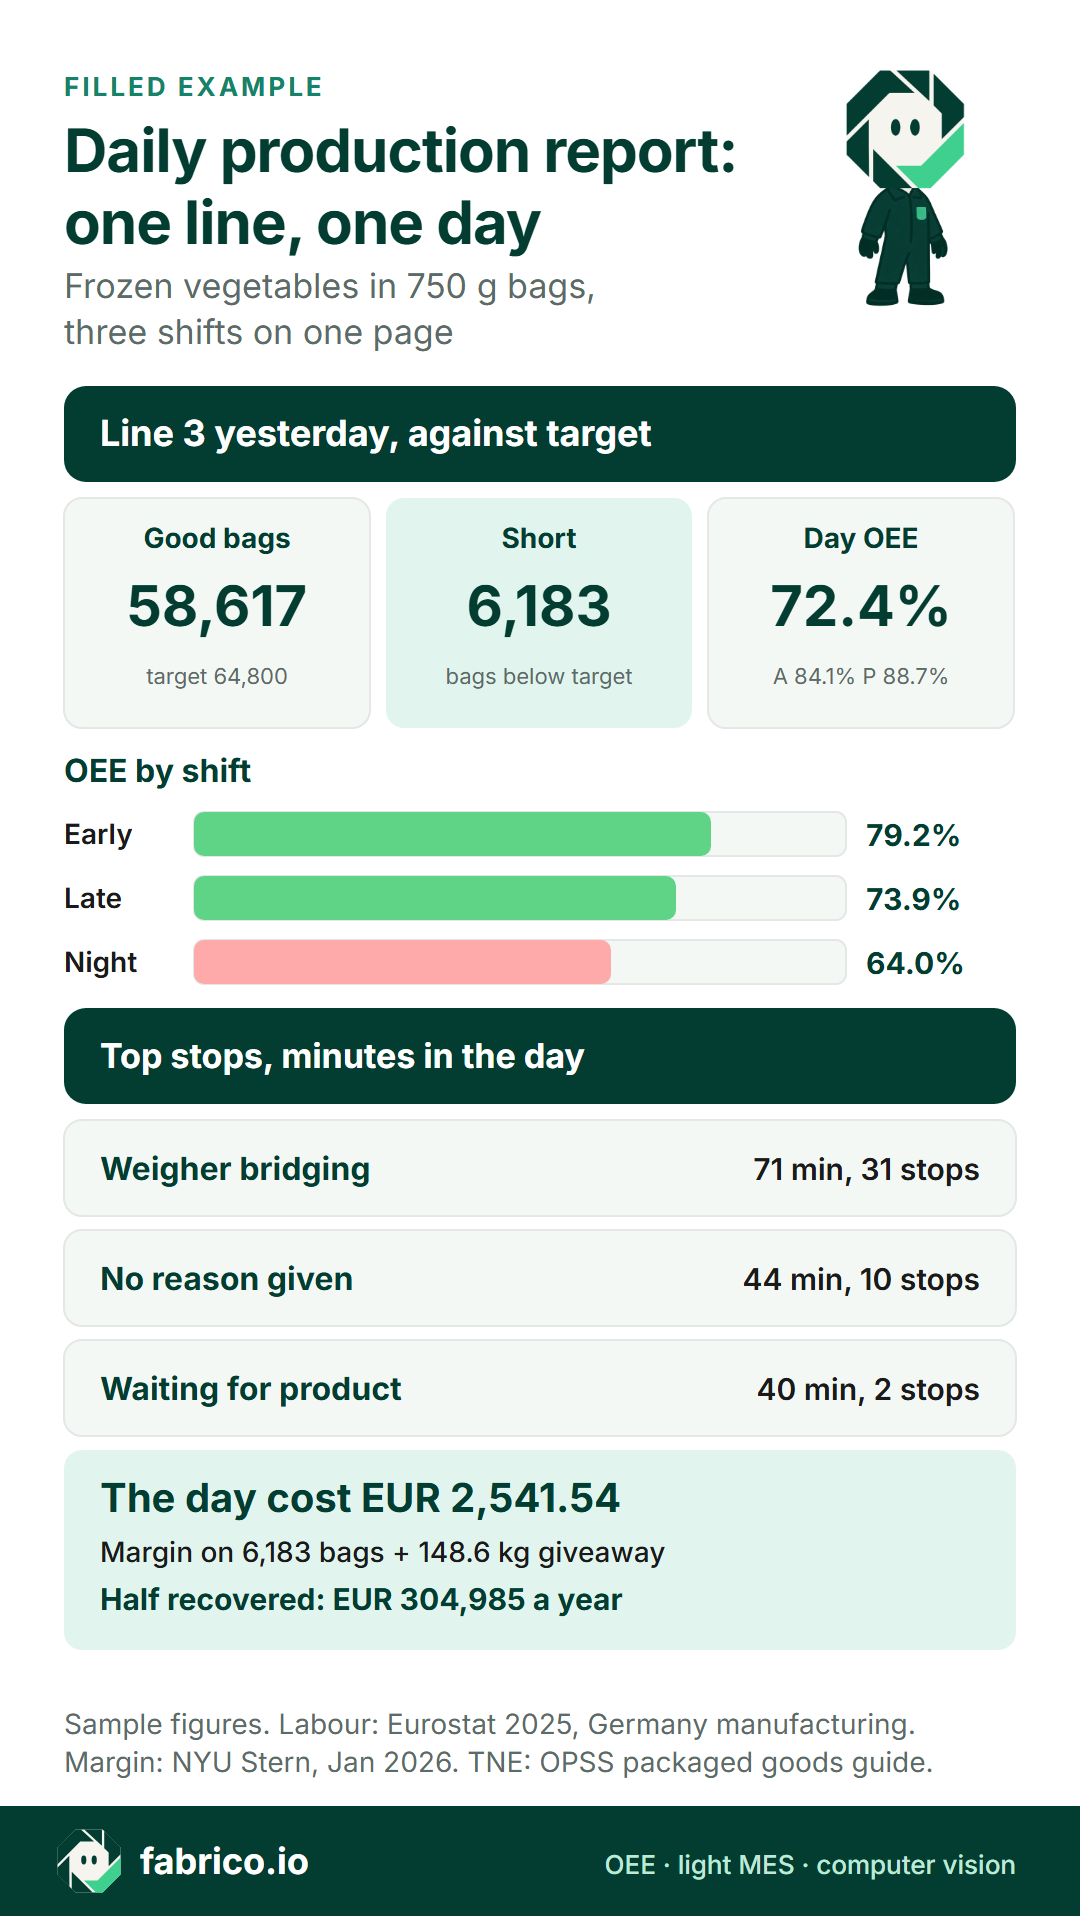
Text version of this infographic
- Line 3, frozen vegetables in 750 g bags, 3 shifts, 1,350 planned minutes.
- Good bags 58,617 against a target of 64,800: 6,183 short. OEE 72.4%.
- OEE by shift: early 79.2%, late 73.9%, night 64.0%.
- Top stops: weigher bridging 71 min, waiting for product 40 min, no reason 44 min.
- Giveaway above the 755 g set point: 148.6 kg.
- The day lost EUR 2,541.54 with the line sold out; base case EUR 304,985 a year at half recovery.
- Sources: Eurostat labour cost 2025, NYU Stern margins January 2026, OPSS packaged goods guide.
The fields that matter, and the ones template sites add that nobody reads
Every field on the page should answer a question someone at the daily meeting will act on. That test keeps twelve fields and drops a long list of others.
| Field | The question it answers | On the sample page |
|---|---|---|
| Planned production time | How much time did the line have? | 450 min a shift |
| Target good output | What should it have made, set before the day started? | 48 bags a planned minute |
| Good output by hour | When did it fall behind? | Block 2 |
| Gap in units | How far behind is the day? | 6,183 bags |
| Run time and stop minutes | How much of the time ran? | Block 1 |
| Stops with reasons, top three | Where did the time go? | Block 3 |
| Bags packed and rejects | How much was made, and how much failed? | Block 1 and 4 |
| OEE by shift, with A, P and Q | Which loss dominates on which shift? | Block 1 |
| Mean fill against set point | Is product being given away? | Block 4 |
| Money of the gap | Does this matter more than yesterday's other problems? | The loss table |
| Yesterday's actions | Did what was agreed happen? | Status by name |
| Today's actions | Who does what, by when? | Block 5 |
Template sites add fields that look thorough and change no decision. Drop these, or move them to the system that owns them:
- Names of everyone on shift. Attendance lives in time and attendance. The daily report needs crew size only where it explains a loss.
- Material consumption by lot. Lots belong to the ERP and the traceability record, not the meeting page.
- "Machine condition: good / fair / poor". A tick box nobody can act on. A stop with a reason says more.
- Free-text remarks for each hour. Hourly comments go unread. One line per open problem, with an owner, goes in the actions block.
- The full stop log in time order. A log is not a report. The top three by minutes go on the page; the rest stay in the log.
- Month-to-date columns beside every figure. Useful once a week, noise every day. Keep one trend line at the bottom.
- Signature boxes. The owner of each field is named in the template, not signed for after the fact.
The daily page is also not the shift handover. What the next shift needs, machine state and temporary measures, belongs in the shift handover checklist, and the record of open problems between shifts in the production shift handover log. The daily report reads those, it does not copy them.
Daily production report format: one page, a review in under ten minutes
The format rules follow from where the page is used: standing at a board or a screen at the start of the day, with the production manager, the shift leads, quality, engineering and the cold store lead in the room.
- One page per line or area. If it needs a second page, a block has become a log.
- A fixed order. The same five blocks in the same place every day, so people look in the same spot without searching.
- Numbers first, then stops, then actions. The page earns its last block, today's decisions, by the four above it.
- Exceptions marked, not everything coloured. In the sample, only hours below 90% of target are bold. A page that is all red reads as all fine.
- Gaps in units and money, not only percentages. 6,183 bags and EUR 2,541.54 start a discussion; 72.4% OEE on its own ends it.
- Ready before the meeting. If someone compiles it during the meeting, the meeting is about the report instead of the line.
Why ten minutes, and why standing: in the study by Bluedorn, Turban and Love in the Journal of Applied Psychology (1999), summarised with its abstract by It Will Never Work in Theory, sit-down meetings ran 34% longer than stand-up meetings and produced no better decisions. The groups had five members and a well-defined problem, which is close to a daily line review. A page that holds only what the meeting acts on is what makes the short meeting possible.
Ten minutes covers yesterday. Patterns across a week, repeat stops and the Pareto by money belong to the weekly downtime report, which the daily page feeds.
Who owns each field
A field without an owner gets filled by whoever compiles the report, from memory, the next morning. Name the owner in the template, and the time by which the field is complete.
| Field | Owner | Comes from | Complete by |
|---|---|---|---|
| Planned time and target | Production manager, from the plan | The plan in the ERP, APS or planning spreadsheet | Before the day starts |
| Ideal rate per product | Process or industrial engineer | Rate trials, nameplate checked against the line | Reviewed each quarter |
| Good output by hour, bags packed | Shift lead | Bagger or checkweigher counter | End of each hour |
| Stop minutes | Shift lead | The machine signal or the stop sheet | As they happen |
| Stop reasons | Operator at the machine | The reason list at the line | Before the stop is closed |
| Rejects and mean fill | Quality | Checkweigher | End of shift |
| OEE and money | Calculated | Formulas on the fields above | Before the meeting |
| Actions and their status | Production manager | The daily meeting | During the meeting |
Two rules make the table work. The person who saw the stop gives the reason, not the person who types the report. And the shift lead confirms counts and rejects before leaving the line, because a count confirmed eight hours later is a guess with a signature. The target belongs to the plan, not to the report: the plan sets it, the report compares against it, and nobody adjusts it after a bad night.
The daily production report format in Excel, with formulas
Excel is a fine place to start. Keep the inputs in one row per line and shift, and let formulas do the rest. With planned minutes in C, stop minutes in D, bags packed in E, rejects in F and the ideal rate a minute in G, row 2 of the sample sheet reads:
| Column | Field | Excel formula | Early shift |
|---|---|---|---|
| H | Run minutes | =C2-D2 | 405 |
| I | Good bags | =E2-F2 | 21,389 |
| J | Availability | =IFERROR(H2/C2,0) | 90.0% |
| K | Performance | =IFERROR(E2/(H2*G2),0) | 90.0% |
| L | Quality | =IFERROR(I2/E2,0) | 97.8% |
| M | OEE | =IFERROR(I2/(C2*G2),0) | 79.2% |
| N | Gap to target | =C2*TargetRate-I2 | 211 |
| O | Margin of the gap | =MAX(N2,0)*Price*Margin | 78.42 |
Four formula rules keep the sheet honest:
- Performance divides by run time, not planned time. Divided by planned time, a stop is counted twice, once in availability and again in performance.
- The day row sums minutes and counts, then calculates. Averaging the three shift OEE figures is only right when the shifts have the same planned time and the same ideal rate; summing is always right.
- OEE is checked two ways. Column M should equal J x K x L. If it does not, an input is wrong.
- Targets and prices live on their own sheet, as named cells. TargetRate, Price and Margin are read by the formulas; a target typed into a row is a target someone will change.
Then protect the formulas, because spreadsheets carry errors at a steady rate. Ray Panko's review of the research, What We Don't Know About Spreadsheet Errors Today (EuSpRIG 2015), reports that field audits with cell-by-cell inspection found errors in 94% of the spreadsheets studied, and that 14 laboratory studies of 967 people building spreadsheets alone averaged a cell error rate of 3.9%. A daily report rebuilt by hand each morning is a new chance for a wrong cell every day. Lock the formula cells, keep inputs in one colour, and have a second person check one day a week against the counter.
Errors that make a daily production report lie
End-of-shift guesses. On paper, the night shift's sheet for the sample day said "stops about 70 minutes". The machine signal shows 105. With 70 written down, the sheet shows availability of 84.4% and performance of 79.0% instead of 76.7% and 87.0%. OEE stays at 64.0%, because good bags and planned time did not change, so nobody notices. But 35 minutes of stops have moved into the speed loss, and the engineer sent to tune the bagger's speed is working on the wrong problem.
"Other" as a stop reason. 44 minutes, 20.5% of the day's stop time, carry no reason. At EUR 49.5 an hour for a crew of 4, that is EUR 145.20 of paid time with no cause attached, and the 19 minutes in the late shift's last hour are stops nobody named before the shift went home. Set a limit, such as one tenth of stop time, and treat anything above it as a gap in the reason list.
A target changed after the shift. A target lowered after a bad night turns a loss into a met target. Fix the rule before the day and show it on the page.
Rejects left in the count. Bags packed is not good bags. The checkweigher's rejects come off before output is compared with target.
Giveaway left off the page. The night shift's 758.1 g mean fill is 3.1 g above the set point on 18,009 bags. No OEE figure shows it; only the checkweigher's mean fill does.
A report that arrives late. A report finished at noon describes a day the line has already repeated. The difference between acting during the shift and reading the result afterwards is covered in real-time OEE vs end-of-shift reporting.
When a spreadsheet stops being enough
The question is not Excel or software in general. It is where the counts and stops come from, and the people-hours a day it takes to turn them into the page. The plant time below is priced at the Eurostat rate of EUR 49.5 an hour; the minutes are sample assumptions for one line and three shifts.
| Route | Plant time a day | People cost a year | Accuracy and what it misses | When it is enough |
|---|---|---|---|---|
| Paper stop sheet per shift, typed into Excel by a clerk | 105 min: 20 per shift lead, 45 for the clerk | EUR 20,790 | Stop minutes guessed at shift end; short stops missing; arrives late morning | One line, one shift, a stable product |
| Hourly counter readings on a board, Excel at the end of the day | 78 min: 2 per hour per shift, 30 to compile | EUR 15,444 | Good hour-by-hour picture; reasons still from memory; no giveaway | When the gap by hour is the main question |
| The machine maker's screens and counters | 30 min to copy figures | EUR 5,940 | Exact counts per machine; no line view across machines, no reasons, no comparison across lines | One machine that is the whole line |
| OEE or light MES software from the machine signals | 30 min: 10 per shift lead to check reasons | EUR 5,940, plus the software: ask each vendor for a price per line per month | Stops and counts from the machine, reasons from the operator; giveaway only if the checkweigher is connected | Several lines or shifts, or when reasons and short stops decide the actions |
| A BI dashboard over ERP bookings | Depends on the build; ask IT for the hours | Ask IT and the BI vendor | Strong on output booked and cost; weak on why a line stopped, because bookings carry no stop reason | Head-office roll-ups across plants |
When the stops and counts come from the machines, the daily page stops being built and starts being read. That is the job of production reporting software, and the buying checks for it are on that page. The walkthrough below shows what the source data looks like on a line screen: a shift timeline, stop reasons and waste.
What you see: a shift timeline, unclassified time waiting for a reason, and the operator's line-down screen, on sample lines. Book a demo.
Plays from YouTube. Google may set cookies when you press play. Privacy policy.
Who should pick which. A plant with one line, one shift and a stable product can stay with a paper sheet and a well-built spreadsheet, if a shift lead fills the stops as they happen and the formulas are locked. A plant with two or three shifts on one line gains first from hourly counts on a board, because shift comparison is its main question. A plant with several lines, or one where stops without a reason pass a tenth of stop time, is choosing its actions from guessed numbers, and should run one line on machine data for a month beside the spreadsheet before it decides. A group with several plants needs the line data first; a dashboard over ERP bookings comes after it, not instead of it.
Questions to put to any vendor of line software:
- Show yesterday for one line: does the day match the sum of its shifts, to the bag and the minute?
- What happens on the daily page to a stop with no reason, and can I see how much stop time has none?
- Where does the target come from, and can anyone change it after the shift?
- Can losses be shown in money with my price and margin per product?
- Can the checkweigher's rejects and mean fill sit on the same page as OEE, and how is it connected?
This week and this quarter
- This week: cut the current daily report to the twelve fields above and the five blocks, and move everything else to an appendix.
- This week: write the owner and the complete-by time next to each field in the template.
- This week: measure the share of stop time with no reason, and add the three missing reasons that come up again and again to the list.
- This week: add the checkweigher's mean fill and the set point to the quality block.
- This quarter: price the gap with your own margin and labour rate, and average it over 20 days before quoting a yearly figure.
- This quarter: run one line on machine counts and stops beside the spreadsheet, and compare stop minutes shift by shift.
Where Fabrico fits
Fabrico is OEE and light MES software with computer vision for the plant floor. For the daily production report it supplies the inputs that are guessed today:
- Real-time OEE (availability x performance x quality) by machine, line and shift, from the machine's PLC or an IoT device with sensors, with micro-stops detected from the signal.
- A line screen with actual against target hour by hour, and stop reasons given by the operator at the machine, so unclassified time is visible until someone names it.
- With the selling price and margin of each product entered, losses are priced in money.
- Where a station has no usable machine signal, the camera add-on counts output; MES and OEE with computer vision covers it. Where the camera add-on covers a station, the video for the minute of a stop can be opened from the shift timeline, streamed on request and not stored in Fabrico.
- Fabrico has a REST API, webhooks and Excel export.
The target stays with the plan in the ERP, APS or planning spreadsheet; Fabrico supplies the measured rates the plan can be checked against. The analytics and reporting page shows the report screens, and OEE software covers how to choose a system.
Sources, accessed 18.11.2026: CBI, frozen vegetables market potential; Eurostat labour cost levels 2025, Germany, manufacturing; NYU Stern margins by sector; GOV.UK, packaged goods regulations guidance; OPSS, guide to the Packaged Goods Regulations 2006; Bluedorn, Turban and Love 1999, via It Will Never Work in Theory; Panko, EuSpRIG 2015.
Questions about the daily production report
What should a daily production report include?
For each line: planned time, run time, good output against target hour by hour, rejects, OEE by shift with availability, performance and quality, the top three stops with minutes and reasons, the money the gap cost, and three actions with an owner and a date. Leave out anything nobody acts on at the daily meeting.
How do you make a daily production report in Excel?
Use one row per line and shift with planned minutes, stop minutes, total count, rejects and ideal rate as inputs. Calculate run time, availability, performance, quality and OEE with formulas, and build the day from summed minutes and counts, never from an average of the shift percentages. Lock the formula cells and keep the target on its own sheet.
What is the format of a daily production report in the manufacturing industry?
One page per line or area, in a fixed order: the day against target, the top three stops, quality, yesterday's actions and today's decisions. It should be readable in under ten minutes at the daily meeting, with exceptions marked and raw logs left in the appendix or the system.
Who prepares the daily production report?
Each field has an owner: operators give stop reasons at the line, shift leads confirm counts and rejects before they leave, quality owns the checkweigher figures, and the production manager owns the targets and the action list. A clerk who compiles it from shift sheets is a sign the data arrives too late.
What is the difference between a shift report and a daily production report?
A shift report hands one shift's state to the next shift. The daily report rolls up all shifts of a day for the production manager, compares shifts on the same definitions, prices the gap and sets the day's actions.
When should a plant move its daily production report from Excel to software?
When stop minutes come from memory, when more than a tenth of stop time has no reason, when compiling the report takes more than an hour a day, or when the report arrives after the meeting it was made for. Then the counts and stops should come from the machines and the report should build itself.
Want to see a day of OEE by line and shift, stop reasons and losses in EUR on a live line screen? Book a demo.
Latest from our blog






Real Fabrico tiles, sample data.