Login
 Blog
Downtime Report: The Weekly Template That Gets Action

Key takeaways
- A weekly downtime report exists to assign three or four actions, not to describe the week.
- Show two Paretos, one by minutes and one by money. They rarely have the same top bar.
- Count repeat stops: the same reason on the same machine, again and again, is often the cheapest loss to remove.
- Keep planned and unplanned time apart, and book any planned activity that ran over its standard as unplanned.
- Every top loss leaves the meeting with an owner, a next step and a date, and last week's actions are checked first.
Monday, nine o'clock. The downtime report for last week runs to twelve pages, sorted by machine number. The line's OEE dropped, and the room splits: the filler crew blames the labeller, the labeller crew blames material. Twenty minutes later the meeting ends with keep an eye on it, and next Monday the same pages come back.
A weekly downtime report should end that loop. Its job is not to list each stop. Its job is to show which losses cost the most, which ones keep coming back, and who will do what about them before the next report.
This guide gives you the structure, a worked sample with a Pareto by minutes and by money, how to treat repeat stops and planned time, and a table template for owners and actions.
A report shows where the time went. Equipment downtime analysis is the next step, and unclassified downtime is the gap to close first.
What a weekly downtime report is for
The daily meeting deals with yesterday: what broke, what is still open, who is on it. The weekly report looks for patterns that one day cannot show. A filler that jams four times a shift looks like noise on a Tuesday and like a project on Friday.
So the weekly report should answer three questions. Where did the time go? What did it cost? What are we changing this week? If a page of the report does not help answer one of them, cut it. Our guide to the daily OEE meeting covers the daily side.

The downtime report template
Six sections are enough for a plant with a few lines. Keep the order fixed so people know where to look.
| Section | What goes in it | Why it is there |
|---|---|---|
| 1. Header | Lines, week, planned production time, total downtime minutes, OEE and Availability per line | The size of the problem in one line |
| 2. Pareto by minutes | Top reasons by lost minutes, with occurrences | Shows where the time goes |
| 3. Pareto by money | The same reasons priced at the agreed value per minute | Shows which loss to fix first |
| 4. Repeat stops | Reasons that happened more than an agreed number of times on one machine | Finds the losses a standard can remove |
| 5. Planned versus unplanned | Planned downtime, unplanned downtime, overruns of planned activities | Stops losses hiding in the planned bucket |
| 6. Actions | Last week's actions with status, then new actions with owner and date | Turns the report into work |
Pareto by minutes and by money
A Pareto by minutes is where most reports stop. It is useful, but it treats every minute as equal, and they are not. A minute lost on the constraint of a sold-out line is lost output. A minute lost on a line with spare capacity is usually recovered later, at the cost of overtime or an extra start.
So price each minute with the rule your controller agrees: contribution margin per minute at the constraint when the plant can sell what it makes, recovery cost when it can catch up. Then sort again. The order changes, and the order is the decision.
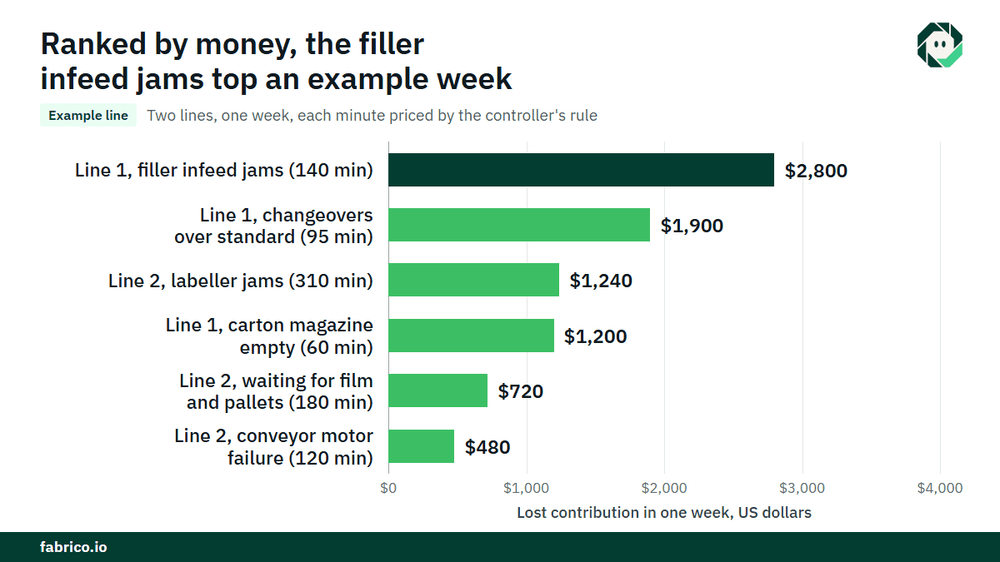
Sample line (illustrative numbers, not a customer): take a plant with two lines. Line 1 is the constraint and sold out. It is rated at 200 bottles a minute with $0.10 of contribution a bottle, so a lost minute is worth $20, or €20 in a euro plant at €0.10 a bottle. Line 2 has spare capacity and catches up on overtime that costs $240 (€240) an hour, so its lost minute is priced at $4 (€4).
| Line and reason | Minutes | Occurrences | Value per minute | Money |
|---|---|---|---|---|
| Line 2, labeller jams | 310 | 62 | $4 | $1,240 (€1,240) |
| Line 2, waiting for film and pallets | 180 | 9 | $4 | $720 (€720) |
| Line 1, bottle jams at the filler infeed starwheel | 140 | 35 | $20 | $2,800 (€2,800) |
| Line 2, conveyor motor failure | 120 | 1 | $4 | $480 (€480) |
| Line 1, changeovers over standard | 95 | 4 | $20 | $1,900 (€1,900) |
| Line 1, carton magazine empty at the case packer | 60 | 40 | $20 | $1,200 (€1,200) |
By minutes, the labeller on Line 2 leads with 310 of the 905 minutes. By money, the order is the filler infeed on Line 1 ($2,800), the Line 1 changeover overruns ($1,900), then the Line 2 labeller ($1,240). The week cost $8,340 (€8,340) in total, and more than half of it, $4,700, sits on two Line 1 reasons that together lost 235 minutes, fewer than the Line 2 labeller alone.
Both charts belong in the report. Minutes tell the line crews and the technicians where the work is. Money tells the plant manager which work to do first. More on how the hourly value is set in our guide to the cost of unplanned downtime.
Repeat stops: the cheapest loss to remove
A repeat stop is the same reason on the same machine, again and again. The carton magazine running empty forty times in a week is not forty problems. It is one missing standard: who refills it, when, and how the case packer warns before it is empty.
Sort the week's reasons on two axes, how often and how long, and each corner points to a different owner.
- Frequent and short: micro stops, jams, empty magazines, label web breaks. These need a standard, a setting or a small change part, owned by the line team and the CI lead.
- Rare and long: breakdowns such as the conveyor motor. These go to the technician, with the stop history attached.
- Frequent and long: the urgent corner. Escalate it the same week.
- Rare and short: leave them on the list and watch the trend.
Repeat stops only show up if short stops are logged at all. A paper log rarely holds a stop under a few minutes, so the frequent and short corner looks empty when it is often the largest.
Planned versus unplanned: keep the bucket honest
A simple rule keeps the report honest: inside planned production time, a machine that is not running is unplanned downtime unless the event is a planned type that was registered before the shift. Breaks, a standard changeover, scheduled cleaning and planned trials qualify. A breakdown never does.
Changeovers need one more rule. Give each changeover a standard time. The standard portion is planned, and every minute over it is unplanned, with a reason. Our article on planned and unplanned downtime definitions covers the full set.
Show the planned total on the report every week. If it creeps up while unplanned downtime falls, the line did not improve. The losses moved bucket.
Owners, next steps and dates
The action section is the reason the report exists. Start with last week's actions and their status, before any new chart. An action list that is never reviewed teaches people that the report is for show.
| Loss | Owner | Next step | Due | Status |
|---|---|---|---|---|
| Filler infeed bottle jams | Line 1 lead and process engineer | Check starwheel guide settings for each bottle format, write the setting down | Thursday | Open |
| Changeovers over standard | CI lead | Watch the next two changeovers, split internal and external work | Next report | Open |
| Carton magazine empty | Line 1 lead | Agree refill trigger and who refills | Wednesday | Open |
Three or four new actions a week is plenty. Ten actions with no capacity behind them is the same as none. When a loss is escalated beyond the line, a written escalation matrix for downtime says who takes it and how fast.
Where the data comes from
A weekly report is only as good as the stop records under it. Three things decide that: whether short stops are captured, whether each stop has a real reason, and whether anyone can check what happened.
Automatic downtime logging from the machine signal captures the start and the length of each stop, including the short ones nobody writes down. The operator then confirms the reason at the line, from a short list. Where the signal says only stopped, a camera watching the station adds a clip, so the weekly review can look at the jam instead of arguing about it. A reason list built for the line, not for the office, keeps the other bucket small; see our guide to downtime reason code design.
Mistakes that kill the downtime report
- Sorted by machine number. Sort by loss. The machine is a column, not the order.
- Minutes only. Without money, the longest loss wins the meeting even when it is the cheapest.
- Other as the top bar. A Pareto led by other is a reason list problem. Promote the most common comments into real reasons.
- No follow-up. If last week's actions are not on page one, they are not happening.
- Shifts as suspects. Compare shifts to find process differences, never to rank people.
Where Fabrico fits
Fabrico is a computer vision enabled Manufacturing Performance Platform. OEE and light MES come first: automatic downtime logging from the machine signal, OEE live by line and shift, and losses priced in money and ranked by money, so the Pareto by money is there each morning instead of being built on Monday.
The operator confirms the reason in one tap, and a camera clip serves as evidence for a stop where a camera watches the station. When the top loss is a breakdown, a work order goes to the right technician with its cost. Plants with several sites get one view across plants, and you can start on one line.
Each plant gets a quote after a review of its lines.
Frequently asked questions
What should a downtime report include?
Planned production time, total downtime and Availability per line, a Pareto of reasons by minutes and by money, repeat stops, planned versus unplanned time, and a list of actions with owners and dates.
How do you make a downtime Pareto chart?
Group the week's stops by reason, add up the minutes for each, and sort from largest to smallest. Then multiply each reason's minutes by the agreed value per minute and sort again for the money view.
Should changeovers count as downtime?
The standard part of a changeover is usually treated as planned. Every minute over the standard counts as unplanned downtime with a reason, so long changeovers stay visible.
How often should a downtime report be reviewed?
Stops are handled daily at the line meeting. The weekly report looks for patterns, repeat stops and the money view, and it assigns the larger actions.
What is a good downtime percentage?
There is no single figure that fits every line. Compare a line with its own baseline, using the same definitions each week, and watch the trend in minutes and money.
See your downtime Pareto in money
Bring last week's downtime report to a demo. We will show the same week sorted by money, with repeat stops and owners on one screen.