

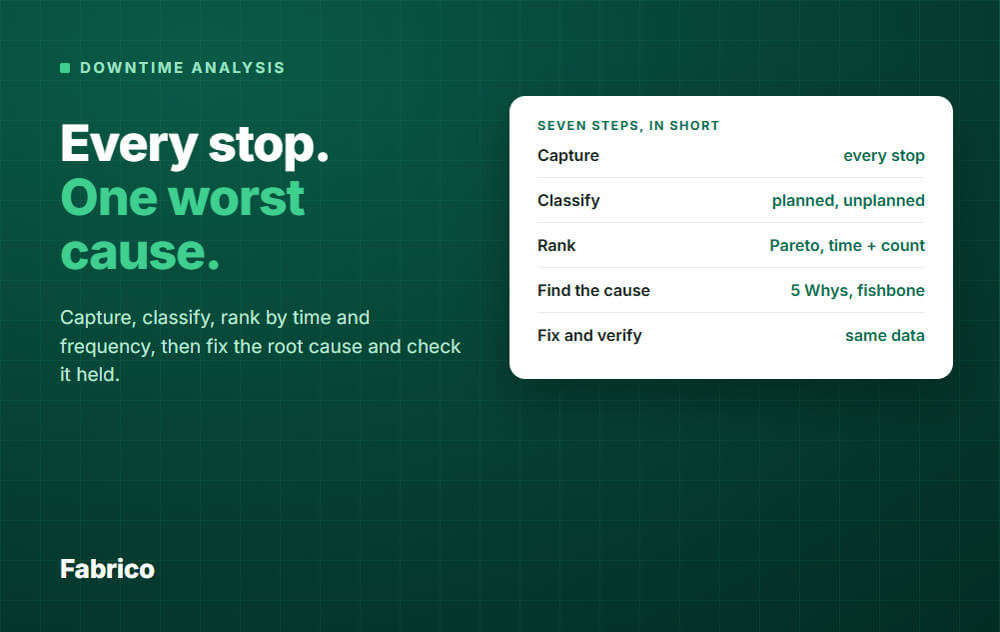

In short: Equipment downtime analysis is a loop. Record every stop with a reason, rank the reasons by time and by frequency, find the root cause of the top few, fix them, and check the numbers again.
Equipment downtime analysis means finding out which stops cost you the most time, why they happen, and whether your fix worked.
It is not a report. It is a weekly habit that moves the biggest losses down the list.
In this article, downtime means any scheduled time a line is not making product, planned or unplanned.
Below is the method in 7 steps, with one worked example. All numbers in the example are made up to show the maths.
You cannot analyse what you did not record. Each stop needs a start time, an end time, the machine or line, and a reason.
Add the product, the shift and a short comment. These make the later steps much easier.
Three rules from R.C. Hansen's OEE method help here:
Paper sheets are fine to start. Over time, reasons get forgotten and times get rounded.
Machine data fixes the times. Operators then only pick the reason. See how this is done in our review of downtime tracking software.
Split the stops first into planned and unplanned. Then link each one to the OEE factor it reduces.
| Type of loss | Example | OEE factor |
|---|---|---|
| Planned stop | Changeover, standard test, planned material loading | Availability |
| Unplanned: caused outside the machine | No material, no operator, waiting for upstream | Availability |
| Unplanned: equipment failure | Motor failure, sensor fault | Availability |
| Unplanned: caused by people or procedure | Wrong material loaded, procedure not followed | Availability |
| Unplanned: caused by material or process quality | Out-of-spec film that jams the sealer | Availability |
| Running below the ideal rate | Line runs at half speed | Performance |
| Scrap and rework | Units that are not good | Quality |
Every stop you log counts against availability. Slow running counts against performance. Bad units count against quality.
Very short stops are the exception. Many plants set a micro-stop threshold and count those in performance instead.
Keep one more bucket apart: excluded time. Hansen uses it for time that was never scheduled for production, such as a maintenance shutdown planned a week or more ahead.
Excluded time is not downtime. If you hide real losses in it, your analysis looks better than your plant.
A Pareto chart sorts stop reasons from largest to smallest and adds a running total. A few reasons usually carry most of the time.
Build it twice: once by total minutes, once by number of stops. They often point to different problems. Our guide on Pareto analysis of downtime covers the chart in detail.
Example: one line, one week, all stops except the planned changeover. That is 540 minutes with a reason, plus 60 unclassified.
| Reason | Minutes | Stops | Share | Cumulative |
|---|---|---|---|---|
| Film jam | 210 | 42 | 35% | 35% |
| No material | 150 | 6 | 25% | 60% |
| Motor failure | 120 | 2 | 20% | 80% |
| Sensor fault | 60 | 15 | 10% | 90% |
| Unclassified | 60 | 8 | 10% | 100% |
Three reasons make up 80% of this time. That is where to look first.
Notice the two views. Film jams are 42 short stops of about 5 minutes. The motor failure is only 2 stops, but each one lasts about an hour.
These need different answers. Add Paretos by line, shift and product as well. A reason that looks small plant-wide can dominate one shift.
A Pareto tells you how much time was lost. MTBF and MTTR tell you if the loss comes from stops that are too frequent or restores that are too slow.
Define "restore" once and use it everywhere. Hansen counts it from the end of production to the start of the next production, so it includes calling, waiting for parts and start-up, not only the repair itself.
Some plants count only the hands-on repair. Hansen calls that repair time and keeps it apart from restore time.
Strictly, MTBF counts equipment failures only. For all unplanned stops, such as a jam caused by bad material, Hansen uses the same sum under the name MTBI.
Example: the line ran 1,500 minutes in the week.
Frequent stops call for prevention. Slow restores call for a faster response. Watch restore time over time as well: Hansen describes a plant where small stops took 1.1 minutes to restore instead of 0.8, and output fell 10% with no single big event to blame.
Take only the top 2 or 3 stops from the Pareto. Go and look at the machine, the log and the operator notes before the meeting.
Ask "why" until you reach something you can change. Usually that takes 3 to 5 questions.
Example for the film jam:
The cause is a missing incoming check, not "operator error". If your answer ends with a person, ask one more why. Usually the cause sits in the process, not in the operator.
Use a fishbone when several causes may combine. Draw the stop as the head and group causes under 6 bones:
Then use your data to cross out the ideas that do not fit. Keep the ones the log supports, for example "only the night shift" or "only product B".
A countermeasure is the action you take against a root cause. Lean practice calls it that because the next improvement will replace it.
Write it down with four things:
Pick fixes that remove the cause. A faster restart helps, but a stop that never happens costs nothing.
After the date, run the same Pareto on the new data. Did the minutes drop? Did the stops drop? Did another reason grow to fill the gap?
If the number did not move, the cause was wrong or the fix was too weak. Go back to step 5.
If it moved, update the standard, close the action and take the next reason from the list. This is a plan, do, check, act loop, run weekly.
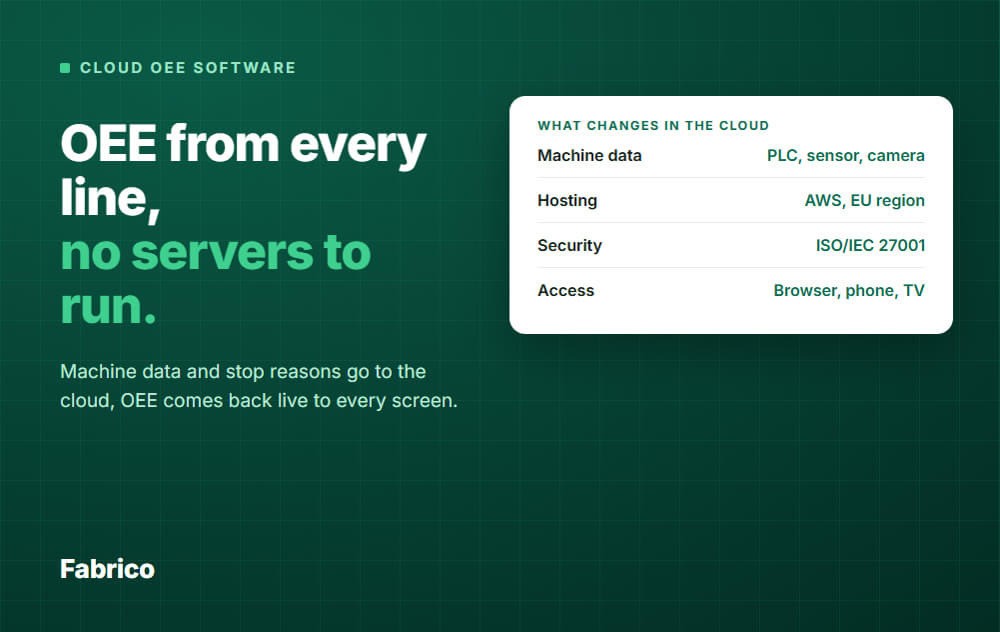
Fabrico is a light MES in the cloud. It records OEE and downtime from machine data (PLC, IoT sensor or camera) together with the reasons operators choose.
It covers the steps above like this:
Read more on Fabrico MES and OEE.
To see your own stops in a Pareto, Request a demo or Contact us.
Downtime % = stop time ÷ scheduled time × 100. Here stop time means all stops, planned and unplanned. Example: 900 stop minutes in 2,400 scheduled minutes is 37.5%.
In this example, availability is the rest: 100% minus 37.5% is 62.5%. Excluded time stays out of both numbers.
Start with one week. A first Pareto from a single week is already useful.
Hansen says three to six months of data is enough to work with. Keep the weekly review going as the data grows.
No. Start at the bottleneck, the machine that limits the output of the line.
Time lost there is lost for the whole line. Time lost at a machine with spare capacity often costs far less.
Short stops add up, and they are the first thing paper logs miss. Pick a threshold, record them the same way every week and review their count as well as their time.
Our page on micro-stops explains how to handle them.
Multiply lost minutes by what a minute is worth. That depends on whether you could have sold the output.
Example: a line that normally runs 600 units an hour at a €2 margin loses €1,200 of margin in one lost hour, but only if that output could have been sold. The free field guide Why lines stop shows how to price a stopped hour.
Ready to see your downtime this way? Request a demo or Contact us.


 Login
 Blog