Login
 Blog

OEE Software for Operators: What to Show at the Line, Hour by Hour

What to show instead: Give the operator units behind or ahead of the target for right now, and the stop running at this moment. Make the OEE percent the small number.
- Act on: stops, stop reasons, rejects, changeover overrun, calling for help.
- Cannot act on: the schedule, product mix, ideal cycle time, a late supplier.
- The test for any number: can this person change it before the shift ends?
- Software to look for: line-side OEE monitoring with a target that pauses for breaks, a stop that appears by itself, and a fast tag.
Picture the wall screen at 08:40. It says OEE 68 percent, in big green digits, and the line has been down for 20 minutes.
The operator looks at it and learns nothing. Is 68 good today? What would make it 70? Nobody on the line can tell you.
That screen was built for the morning review. Here is what an operator can use instead, walked through one example shift.
Why the OEE percent gives an operator nothing to do
OEE is a sound measure, but it is a result, made from several things at once.
It moves with stops, speed and rejects. It also moves with the ideal cycle time someone set for the product, and with what counts as planned time. See how OEE is calculated.
So use one test for any number at the line: can this person change it before the shift ends?
This test is our own view, not a published rule.
- "OEE 68 percent": no clear move follows.
- "240 units behind, line stopped 20 minutes": tag the reason, call for help, prepare the restart.
The number to show: units against the target for now
Lean plants have long used a production analysis board beside the process, comparing planned and actual output, often hour by hour.
The key word is "now". A target for the whole shift tells you little at 08:40. A target for this minute tells you whether you are winning.
How to turn OEE into units: example
All numbers on this page are example data. The line runs a 06:00 to 14:00 shift.
| Item | Example |
|---|---|
| Shift length | 480 minutes |
| Planned break | 30 minutes, so 450 minutes of planned production time |
| Planned changeover | 30 minutes, so 420 planned running minutes |
| Ideal cycle time | 3 seconds, or 20 units a minute |
| OEE target | 70 percent |
The simple formula is good count times ideal cycle time, divided by planned production time. Run it backwards:
- 70 percent of 450 minutes is 315 minutes of good output.
- 315 minutes at 20 units a minute is 6,300 good units. That is the shift target.
- 6,300 units over 420 running minutes is 15 units a minute. That is the target rate.
- 1 OEE point on this shift is 90 good units.
So the target for now is simple: 15 units for each planned running minute so far. It stands still during the break and the planned changeover.
One example shift, hour by hour
The normal running rate is 18 units a minute, so the line gains 3 a minute on a target of 15.
05:50 to 06:30: the start
Screen: last shift's open items, product, target rate.
Operator: reads the handover, checks setup, then starts.
Material arrives 8 minutes late, and the operator tags it. By 06:30 the target is 450 and the count is 396: 54 behind.
The operator did the right thing and still starts behind, so never use this number to judge a person.
06:30 to 07:30: the gap grows and nothing has stopped
Screen: running, but the gap slips from 54 to 90 behind, at a time when 18 a minute should be closing it.
Operator: sees that the rate is wrong even though no long stop appeared. A labeler is jamming: about 20 jams of 35 seconds, near 12 minutes in the hour.
Nobody wants to tag 20 tiny stops. Agree a length below which no tag is needed, and let the machine signal list them.
One call to the team lead, and the guide is reset under standard work.
Shift OEE so far rose in this hour, from 66 to 70 percent, as the late start faded. The gap still grew, because the line ran below its target rate.
07:30 to 08:45: the long stop
The line recovers well and is 60 ahead by 08:20. Then a conveyor drive faults, and the line is down for 25 minutes.
Screen: stop timer running, gap falling by 15 a minute.
Operator: does three things, in this order.
- Tags the reason, or tags "waiting" until the cause is known.
- Calls for help, as soon as your agreed time limit is passed. A lit andon is the classic way to summon a quick response.
- Uses the wait: clears the line, and prepares the restart.
By 08:45 the line is 315 behind. Worth teaching on the floor: at 3 units a minute of catch-up, each stopped minute takes 5 running minutes to win back.
That is why a fast call matters. Never answer a gap by asking people to run above the approved speed: that trades it for scrap or a safety risk.
09:30 to 10:00: the break
Screen: target paused, gap steady at 180 behind, after winning back 135 since 08:45.
Operator: takes the break.
A target that keeps counting would show 450 more units behind after 30 minutes. In our view, operators will not trust that number.
10:00 to 11:30: rejects
At 10:30, labels start going on crooked, and 60 units are set aside. There are also 8 minutes of smaller stops.
Screen: good count drops by 60. The gap ends at 114 behind.
Operator: holds the batch under your quality rule, logs the scrap with a reason, and tells the team lead.
Count good units, not total units. If the screen counts only total output, a line can look on plan while making scrap.
11:30 to 12:12: the changeover
Screen: changeover timer against the 30 minute standard, target paused.
Operator: works the changeover steps. It takes 42 minutes because a tool was missing, and tags that.
The 12 extra minutes cost 180 units, and the gap is now 294 behind.
12:12 to 14:00: the end of the shift
The line gains steadily, then waits 15 minutes for material at 13:10. It ends with 6,060 good units against 6,300: 240 behind.
Operator: checks that stops have reasons, and leaves a line for the next shift about the labeler and the tool.
The manager's half: what comes back the next day
For the review, the same shift becomes OEE: 6,060 units at 3 seconds is 303 minutes, over 450 planned minutes, or about 67 percent. The 240 units are about 2.7 points.
So you lose nothing by showing counts on the floor. Both views read from the same events.
The next morning, the shift gives you a ranked list:
| Loss, example | Units against target | Owner |
|---|---|---|
| Conveyor drive fault, 25 minutes | 375 | Maintenance |
| Material wait at 13:10, 15 minutes | 225 | Logistics |
| Changeover overrun, 12 minutes, missing tool | 180 | Team lead |
| Labeler jams, about 12 minutes | 180 | Process engineer |
| Late start, 8 minutes | 120 | Logistics |
| Smaller stops after the break, 8 minutes | 120 | Process engineer |
| Crooked labels, 60 rejects | 60 | Quality |
These add up to 1,260. The line won back 1,020 by running at 18 a minute against a target of 15, which leaves the 240.
Almost none of these losses belong to the operator, whose job was to see, tag and call each one.
Then close the loop out loud: "You tagged the missing tool, and there is now a tool kit on the line." Without that, people stop tagging, and your data goes with it.
What the operator owns, and what they do not
| In the operator's hands, this shift | Someone else's |
|---|---|
| Seeing a stop and tagging the reason | Fixing a recurring fault |
| Calling for help on time | How fast help arrives |
| Holding suspect product, logging scrap | Late material from a supplier |
| Leaving a clear handover | The schedule and product mix |
| Setting the line to the standard | The ideal cycle time and OEE target |
Score people on the right column and numbers get fiddled, by quiet retagging or skipped entries.
What to demand of a tool
We sell software in this category, so test ours with this list as well. Ask to see each one, not hear about it.
- Target for now: does the target pause for breaks and planned changeovers? Show it across a break.
- Count: where does the count come from, and do rejects come off it?
- The stop: does a stop appear by itself, from a machine signal, with a timer running?
- The tag: how many taps, from your own short list? Time it. Our guide to the operator terminal suggests about 3 taps and 10 seconds as a rule of thumb.
- Short stops: can they be listed without asking for a tag on each one?
- Help: who gets told about a stop, by what rule, and how fast?
- Distance: can you read it from where the operator stands? Our guide to the production display board covers the size and layout.
- One truth: are the operator count and the manager OEE built from the same events?
Common mistakes
- Putting the office dashboard on a TV and calling it done.
- Ranking operators by name on a public screen.
- Collecting reasons and never telling the crew what changed.
Which types of platform make OEE work for operators?
Setup matters more than type, and products vary within each type. Use this as a first filter.
| Type | What the operator tends to get | Check this |
|---|---|---|
| BI or ERP reports | Little during the shift, since they serve the review | How old is the data on screen? |
| OEE and production monitoring software | Live status, count against target, stop tagging | Is the screen made for the line, or for the office? |
| Full MES | Work instructions and job steps, often with OEE as one module | How long is the rollout, and is the stop tag still fast? |
| Andon systems | A strong call for help | Does the call feed your loss data? |
| Frontline apps and digital checklists | Tasks, forms and instructions | Where do machine stops and counts come from? |
| Paper hour by hour board | A visible plan and a written reason | Who fills it in, and are entries made on time? |
To build a shortlist, use our guide to OEE software, then test it against the list above.
How Fabrico fits
Fabrico is a light MES: cloud software for OEE and downtime. At the line:
- Stops are recorded where a PLC, IoT sensor or AI camera gives a signal. Lines with no sensor can enter counts and stops by hand on a tablet.
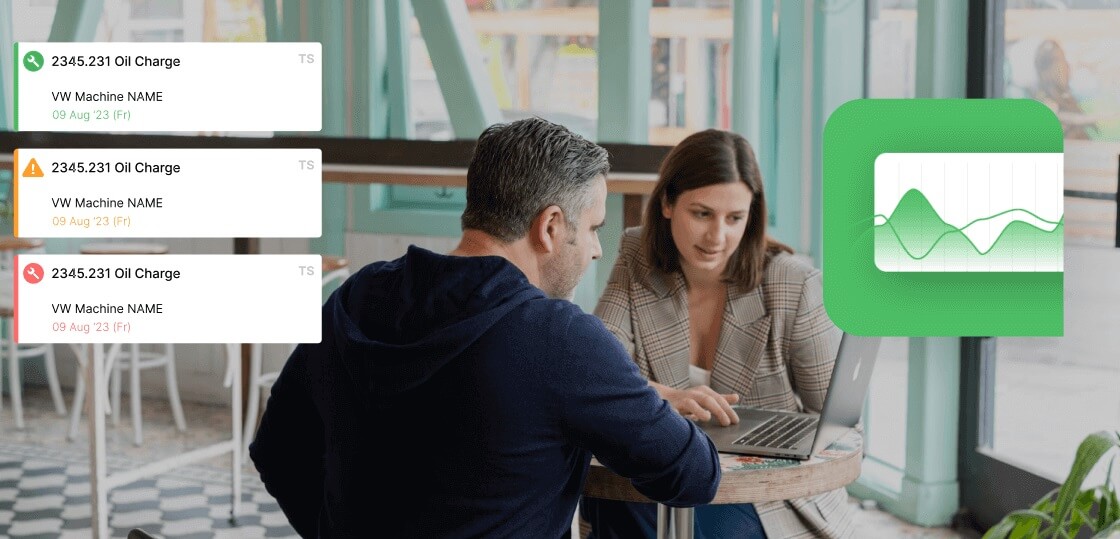
- When a stop is detected, a card shows the downtime counter, with quick actions to add a reason, start a changeover or create a task.
- The operator picks the cause from your own reason codes, on a tablet or phone.
- A TV screen by the line shows live state, OEE and produced against target.
- Micro-stops are detected from the machine signal and listed apart from long stops.
- Changeovers are tracked against standard times, and scrap is logged by reason.
- Push, in-app and email alerts follow rules by role and shift.
- Results by shift are there for the next shift.
Where it stops: dashboards are configured per company, not per user.
It is not an andon system, and it does not stop machines. Production scheduling is not in Fabrico today, and job dispatching, BOMs, routings and genealogy stay in your ERP.
Fabrico is cloud software and the app has no offline mode, so the app needs a working connection at the line. If the link drops, the gateway can store machine data offline for up to 30 days, with automatic recovery within 72 hours by default.
The target method on this page is general, not a description of our screens, and this page does not say how our target treats a break or a changeover. Ask to see it, as you would with any vendor.
Plan on about 1 month to install and connect devices, and 3 to 4 months for a full rollout.
Read the Fabrico MES and OEE overview, then Request a demo or Contact us.
What people ask next
Should operators see OEE at all?
Yes, if it is smaller than the count and has a target beside it. Hiding it creates suspicion, and some crews will want to learn it.
What if we run many products, so units do not compare?
Show minutes behind instead. Turn each product's gap into minutes at its own target rate, then add them: in the example, 240 units at 15 a minute is 16 minutes behind.
What about a line that runs to pull signals, with no fixed plan?
Compare output with what the next process has asked for. The Lean Enterprise Institute's entry on the board describes that version.
How do I set the target rate?
Start from your OEE target and the sum above. If the line never gets near the result, people will ignore it.
Will this work where a line has no sensors?
It can, with hand-entered counts, but expect a slower signal and missed short stops. Agree how often the count gets updated.
Want to see this on your line? Request a demo or Contact us.