Login
 Blog
Production Display Board: What to Show on Shop Floor Screens

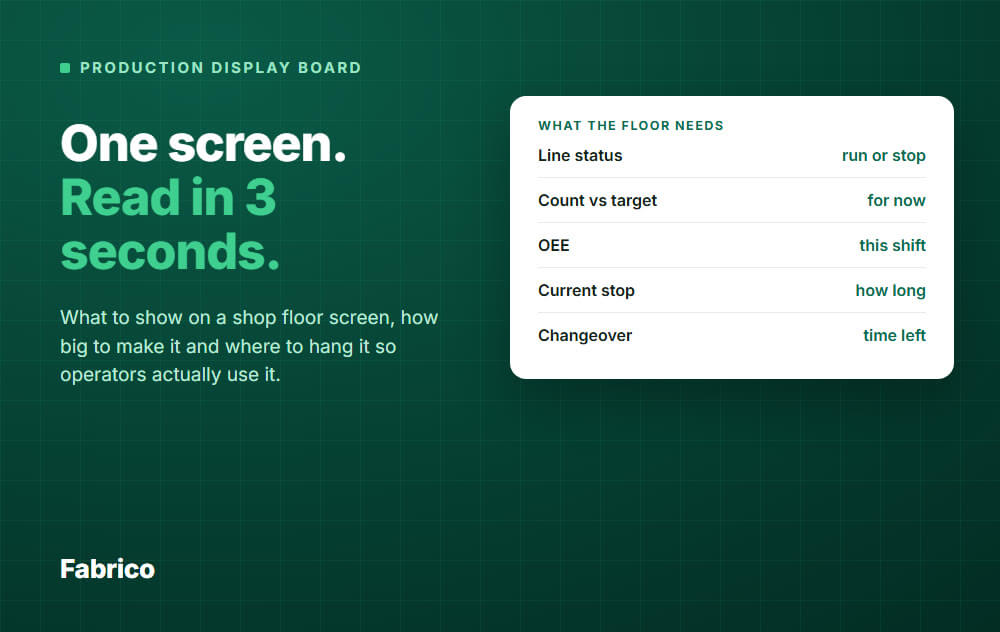
In short: a production display board should answer one question from across the room: are we on track right now, and if not, why?
- Show five things: line status, count against the target for this moment, OEE against its target, the current stop with its running time, and changeover time left.
- Make the key numbers huge, use strong contrast, put words next to every colour, and test it at the farthest spot where people work.
- Mount it just above head height with a clear line of sight, facing the people who can act. Refresh about once a minute or faster and show the time of the last update.
- Keep detail, trends and history for the office screen. The floor screen is for action.
What a production display board is
A production display board is a screen on the shop floor that shows live line status to the people who run the line.
You will also see it called a production monitoring display, a shop floor display or an OEE display.
Today it is usually a TV or monitor on a wall or a pole. Some plants use a bar of lights, a segment display, or a whiteboard filled in by hand each hour.
It is a visual management tool. Anyone walking past should see what is normal and what is not, without asking.
It is not the same as an OEE dashboard in the office. A dashboard is for analysis, and a display board is for the next five minutes.
What makes up a production monitoring display system
The screen is the small part. A working system has three layers.
- Data source: a PLC, sensor, camera or counter gives the count and the stops. Operators add the stop reasons.
- Software: turns those signals into status, count against target and OEE, and draws the screen.
- Screen: a TV or monitor with a browser or small player. Use a cable where the wifi is weak.
A hand-filled board can work on one line. It lags by up to an hour, though, and it depends on someone having time to write.
What to show on a shop floor screen
Start with the questions an operator or team leader asks ten times a shift.
| Show | Why it earns its place |
|---|---|
| 1. Line status, as a big colour band with words | Running, planned stop, unplanned stop, changeover. Clear at a glance. |
| 2. Produced against target for now | Tells the team if they are ahead or behind the plan at this hour, not only at the end of the shift. |
| 3. OEE against its target | One number for the shift so far, with the target next to it so it means something. |
| 4. Current stop, how long it has lasted, and its reason once tagged | Everyone can see how long the line has been waiting and what for. |
| 5. Changeover time left | During a changeover, time left against the standard time. A negative value shows a delay. If you have a plan feed, you can also show the time to the next one. |
| Optional: product and shift | So people know which job the numbers belong to. |
That is five items. Resist the urge to add more.
Availability, performance and quality can sit as smaller numbers under OEE, still readable from the work position. They help a team leader see where the gap is.
See how OEE is calculated if you need the maths.
Show the target for now, not only the target for the shift
This is a common design miss. A screen that says "1,050 of 2,400" tells nobody if the line is on pace.
Show the target for this moment instead. That is the number the line should have reached by now.
Example (hypothetical numbers): a shift runs 06:00 to 14:00 with a plan of 2,400 units. That is 300 units an hour, with no breaks to keep the numbers simple.
- At 10:00, four hours have passed, so the target by now is 1,200 units.
- The line has made 1,050. It is 150 units behind.
- To still hit 2,400, the last four hours need 1,350 units, or about 338 an hour. That is 12.5% faster than plan.
Now the team can decide early: catch up, re-plan, or call for help. At 13:30 the same information would be too late.
On a real line, the target for now must pause during planned breaks. If it keeps climbing, the board shows the team as behind after every break, and people stop trusting it.
The same example gives an OEE. Planned time so far is 240 minutes, with no planned stops in this window.
- Availability: the two stops in the figure below add up to 37 minutes, so the line ran 203 of 240 minutes. That is about 85%.
- Performance: say the ideal rate is 345 units an hour. In 203 minutes that is about 1,167 units, and the line made 1,050. That is about 90%.
- Quality: say 98% of the units are good.
- OEE: 0.85 × 0.90 × 0.98, or about 75%.
OEE and the count against plan are different numbers. Here the count is 87.5% of plan, because it compares with the plan rate of 300, while OEE compares with the ideal rate of 345.
What not to show on the floor
Every extra number makes the important ones harder to see.
- Long histories and trend charts. Put them on an office screen or a weekly review.
- Ten KPIs at the same size. If everything is big, nothing is.
- Rotating pages. A stop that happens while the screen shows another page is missed. Use one page per line.
- Scrolling or anything that needs a click. A wall screen has no mouse.
- Individual names or rankings. The board is about the process, not about people. Blame kills honest stop reasons.
- Decoration. Logos, gradients, animations and thin fonts cost readability.
- Numbers without a target. "OEE 68%" means little. "OEE 68%, target 80%" is a message.
Make it readable from a distance
A screen that cannot be read from the work position is wallpaper. Design for the farthest person who needs it.
Size
There is no standard for floor screens. A common signage rule of thumb says the longest reading distance is about 150 times the text height.
| Farthest viewer | Smallest text they must read |
|---|---|
| 5 m | about 3.5 cm tall |
| 10 m | about 7 cm tall |
| 20 m | about 14 cm tall |
Treat that as the limit, not as comfort. Fewer numbers leave room for bigger ones.
Example: a 55 inch TV has a picture about 68 cm tall. On the layout above, the main count would be about 11 cm tall, which reaches about 17 m.
The small labels would be under 4 cm, which reaches only about 5 m.
The real test: stand at the farthest working spot. Can you read the status and the main number in three seconds?
Contrast and colour
- Use dark text on a light background or the reverse, with strong contrast. The web accessibility standard (WCAG AA) asks for at least 4.5 to 1 for normal text. Aim higher on a floor screen.
- Be careful with dark themes in bright halls or near windows. Glare can wash them out.
- Never rely on colour alone. Some people are colour blind, and for many of them red and green look alike. Always put a word next to the colour.
- Use a bold, plain font. Avoid thin weights.
Layout
- One big number per idea, with a short label.
- Status at the top, where people look first.
- Same layout on every line, so people read any screen without thinking.
Where to mount it, and how many screens
- Height: just above head height. A bottom edge around 2 metres is a starting point, not a standard. Go higher if machines, racks or forklifts block the view.
- Direction: facing the operators and team leader who can act on it, not the aisle.
- Glare: away from windows and direct light.
- Environment: dust, heat or washdown areas need a protective enclosure or an industrial display. Keep it away from the product in food areas and check your hygiene rules.
- One screen per line or cell where possible. A single plant-wide screen is read by nobody who is busy.
- A second view for supervisors: a screen or tablet that shows all lines side by side so they know where to walk first.
Refresh rate and stale data
A refresh about once a minute is a practical minimum. Status and the stop timer should change within seconds.
The bigger risk is a screen that quietly freezes. A board that shows old numbers is worse than a blank board, because people trust it.
Show the time of the last update, or make the screen turn obviously "no data" when the feed stops.
The board is only as good as its data. If stops are typed in hours later, the screen is late.
Machine data (PLC, IoT sensor or camera) starts the clock automatically, and the operator then adds the reason. See production monitoring software for how that works in practice.
Use the board in andon style
In lean, an andon is a signal that flags a problem and calls for help. The point is the response, not the light.
A display board can work in an andon style. A stop turns the band red, the timer runs, and people see it from afar.
But a screen alone calls nobody. Agree three things:
- Who responds to which signal.
- How fast. Write the times on the wall.
- Who goes next if the stop lasts longer.
Example escalation (for illustration, not a standard). Your times will differ.
| Stop has lasted | What happens |
|---|---|
| 0 to 5 min | Operator troubleshoots. |
| 5 min | Cause known: operator fixes it, logs the cause and restarts. Cause not known: the mechanic is called. |
| 30 min | Technician is called. |
| 90 min | Engineer and shift supervisor are involved. |
| 150 min | Process experts and the department manager are told. |
A stop that keeps coming back deserves faster steps. What matters is that the timer on the screen and the rule on the wall agree.
Very short stops need a rule too. Many small stops can cost more than one long one, and they usually count as performance loss, not availability.
The threshold you pick decides which is which, and what the board shows as a stop. Read about micro-stops before you set it.
Common mistakes
- Putting the office dashboard on a TV and calling it a floor display.
- Designing at a desk and never testing at the real distance.
- Screens facing the wrong way or hidden behind a machine.
- A target for now that ignores breaks.
- No owner. Nobody updates reasons, so the board fills with "unclassified".
- No response rule, so the red band changes nothing.
A good board passes a simple test. A stranger at the farthest work spot can tell in three seconds if the line is on track, and the team can say who comes when the band changes.
To learn which stops cost the most, pair the board with a downtime tracking routine and review the top reasons weekly.
How Fabrico handles the production display
Fabrico is a cloud light MES for OEE and downtime. It takes machine data from PLCs, IoT sensors or cameras, and adds the stop reasons that operators select.
It has a TV status screen made for large shop floor displays. It shows the live state of the line, OEE and produced against target.
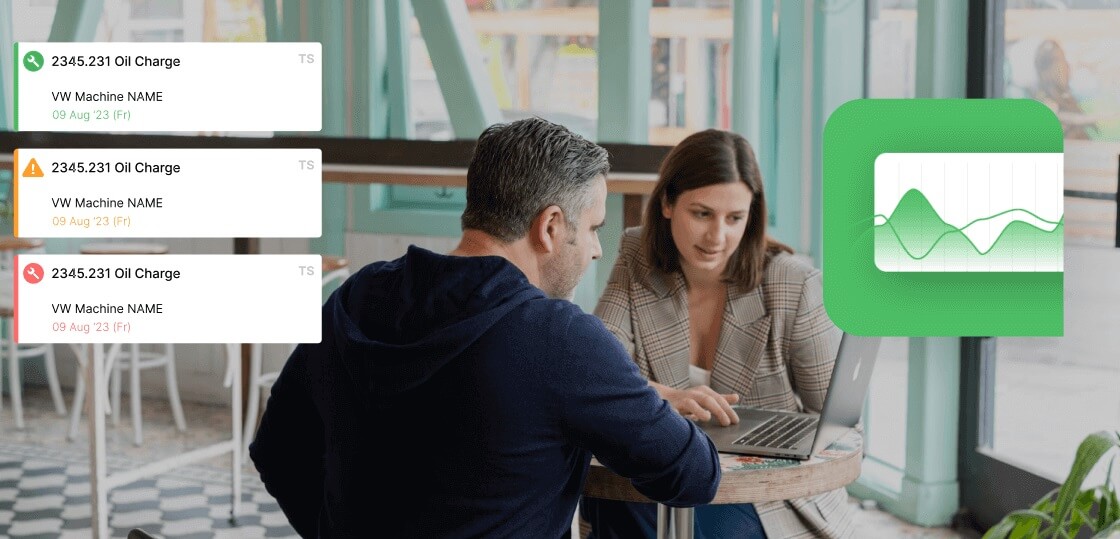
When the line goes down, operators get a card with a downtime counter and quick actions: add stoppage reason, start changeover and task.
Planned and unplanned stops are kept apart, and changeovers are tracked against standard times.
Supervisors see an overview with one card per line, showing status and OEE. Push, in-app and email notifications follow rules by role and shift.
Treat the TV screen as andon-style visual management. It is not an andon system and it does not stop machines.
See Fabrico MES and OEE for the wider product.
What people ask next
What size TV do I need for a shop floor display?
Work back from the farthest viewer. With the rule of thumb above, someone 10 m away needs the smallest text they must read to be about 7 cm tall.
A 43 inch TV has a picture about 54 cm tall, a 55 inch about 68 cm and a 65 inch about 81 cm. Test with a real screen at the real distance before you buy ten.
What is the difference between an OEE dashboard and a display board?
A dashboard is for analysis in the office: trends, comparisons, drill-down. A display board is for the line: status, count against target now, current stop.
Use both: the dashboard for the weekly review, the board for the shift.
Is a production display board the same as an andon?
No. An andon is a call for help with a defined response, while a display board shows status.
It becomes andon-style when a stop is visible at once and a rule says who comes.
How do I get stop reasons onto the board?
Let the machine data start the stop, then ask the operator for a reason with a few taps from a short list. Review "unclassified" time every day.
Group reasons into planned and unplanned, and decide how each one counts. A changeover is planned, but it usually still counts as an availability loss.
See OEE availability.
Can I use a normal TV?
Often yes, in a clean and dry area. Check that it is rated for long daily running, and turn off its sleep timer so it does not go dark mid-shift.
For dust, heat or washdown, use an enclosure or an industrial display.
Should the board show OEE at all?
Yes, but with its target and with the stop and count beside it. OEE is a result, and operators act on stops, count and changeovers.
Request a demo or Contact us to see the TV status screen in action.
Latest from our blog