Login
 Blog
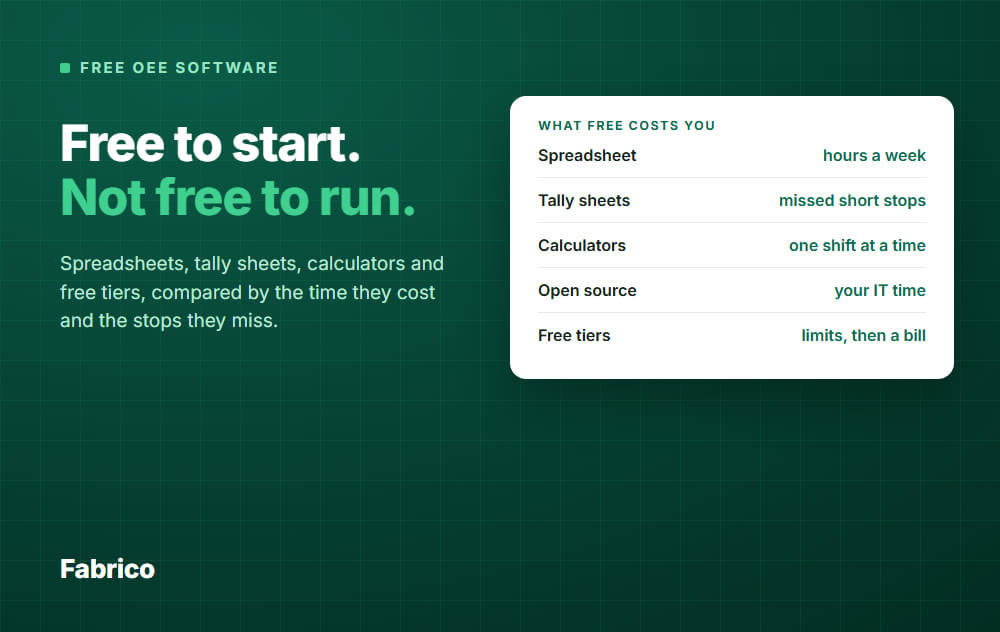
Free OEE Software: Real Free Options, Hidden Costs and When to Move On

In short: Yes, you can track OEE for free. A spreadsheet, a paper tally sheet or a free calculator will give you a first number this week.
What you pay with is time and accuracy: free tools depend on people writing everything down, and the short stops are the first thing they skip.
- Free options: spreadsheet template, tally sheets, online calculators, open-source or DIY with a PLC and a dashboard tool, and the free tiers or trials some vendors offer.
- Free is a good way to learn on one line and prove OEE is worth tracking.
- You have outgrown it when numbers are typed in late, people argue about them, or you need a live view of several lines.
- Fabrico is paid software with a price set for your plant. It has neither a no-cost tier nor a trial period.
What does "free OEE software" really mean?
Most searches for "free OEE software" end up in one of five places.
They are very different tools, and "free" means something different in each.
- Free to download: an Excel or Google Sheets template.
- Free to do: paper tally sheets and a whiteboard at the machine.
- Free to try: online OEE calculators that take a few numbers and return a percentage.
- Free to license: open-source tools you build and host yourself.
- Free for a while, or for a little: a vendor free tier with limits, a time-limited trial or a short free proof of concept.
None of them is a scam. Each one has a price that does not show up on an invoice.
The free options, and what each one costs you in time
Here is the honest side by side. The cost column is not money. It is the hours and the data quality you give up.
| Option | Money | Hidden cost | Data quality |
|---|---|---|---|
| Spreadsheet template | None | Someone types the data in, every shift, and keeps the formulas safe | Depends on the person; short stops go missing |
| Paper tally sheets | Paper and a pen | Collecting, reading and typing the sheets up | Good for counts and big stops, weak for timing |
| Free calculators | None | You still need the inputs, and nothing is saved | One number, no history, no reasons |
| Open-source or DIY | Software is free | Engineering time to connect, build, host, secure and maintain | Can be very good, if the person who built it stays |
| Vendor free tier or trial | None, for a limited scope or time | Setup effort, then a decision at the end | Good, but only inside the limits |
1. A spreadsheet template
This is where almost every OEE journey starts, and for one line it can be enough.
You enter planned time, stops, units made and good units, and the sheet works out availability, performance and quality.
The weak point is the entering. Once OEE is used in the daily meeting, somebody has to type the data every shift, and that somebody has a real job.
Versions multiply too: three copies of the file, three slightly different formulas.
A sheet that works has one row per shift and these columns: planned minutes, stop minutes, ideal rate, units made and good units.
- Availability = (planned minutes minus stop minutes) divided by planned minutes
- Performance = units made divided by (ideal rate times run minutes)
- Quality = good units divided by units made
- OEE = availability times performance times quality
See how to calculate OEE before you trust any template, so you can check its maths.
2. Paper tally sheets and a whiteboard
A sheet on the machine with a column per hour: count, good, and a mark for each stop with a reason.
It is cheap and operators understand it at once. It also makes people stand at the machine and think about why it stopped.
The cost is the second step. Someone has to collect the sheets and turn them into numbers, so the answer arrives the next day or the next week.
3. Free OEE calculators
These are fine for a quick check or for teaching a new team how the three factors fit together.
They are not a tracking tool. They keep no history, no stop reasons and no comparison between shifts.
4. Open-source or DIY with a PLC and a dashboard tool
Some teams read signals from a PLC or a sensor, store them in a database and draw the result in a free dashboard tool.
The licence costs nothing. The project costs a lot of engineering time: connecting to each machine type, defining what counts as a stop, building the screens, hosting, backups, security and updates.
The biggest risk is people, not software. If the engineer who built it moves on, you own a system nobody can fix.
It is a good fit when you already have in-house automation and IT skills and enough spare time to keep it alive.
5. Vendor free tiers, trials and proofs of concept
Some software vendors offer a no-cost tier with limits, a trial period of a set number of days, or a short proof of concept on a real line.
They are a fair way to see real machine data. Check the limits before you start:
- How many machines or lines are covered?
- How many users can log in?
- How much history is kept? Trends need months.
- Can you export your data when it ends?
- What happens to your setup on the last day?
Treat a free tier as a test. Do not plan a plant on it.
What free really costs: a worked example
The biggest hidden cost is accuracy. People write down the stops they remember, and they remember the long ones.
Take one 8-hour shift on one line. All numbers here are an example.
- Planned production time: 480 minutes.
- The operator wrote down 3 stops that added up to 45 minutes.
- The machine signal shows 40 more short stops of about 2 minutes each, 80 minutes in total, that nobody wrote down.
Availability is run time divided by planned time. The two records give two answers:
- Hand log: (480 minus 45) divided by 480 = 90.6%
- Machine data: (480 minus 45 minus 80) divided by 480 = 74.0%
Nobody lied. The short stops were simply too small and too frequent to write down. These are micro-stops, and together they can be a large part of the loss.
Some teams count very short stops as a speed loss instead of availability. OEE comes out the same either way, so pick one rule and keep it.
A team that trusts the first number goes looking for a problem in the wrong place. It is the same shift, but two very different stories about where the time went.
How to start with free and get something useful
If you are going to start free, do it in a way that gives you real data.
- Pick one line, ideally the bottleneck. Do not start with the whole plant.
- Fix the ideal rate per product and write it down. Do not change it halfway through.
- Make a short list of stop reasons, 8 to 10, with no "other". Operators need to pick quickly.
- Log every stop, including the short ones. A tally mark and a reason is enough.
- Calculate once a week using the standard OEE formula, and check that the losses add up to the time you planned.
- Rank the stops by lost time and fix the biggest one first. A simple Pareto of downtime does this well.
Do this for 4 to 6 weeks. By then you will know if OEE is worth the effort in your plant, and where free starts to hurt.
To put a price on what a stopped hour costs you, the free field guide on why lines stop walks through it.
Signs you have outgrown free
You do not need to leave free tools early. If you have one line, the team trusts the log and the numbers lead to fixes, stay where you are.
Move on when you see these:
- The data is typed in after the shift, so you find out about a problem a day late.
- People argue about whose number is right.
- Someone spends hours a week keeping the sheet alive.
- You suspect micro-stops are hidden, but you cannot see them.
- You now have several lines, shifts or sites, and the sheets do not add up.
- Management asks what the losses cost in money, not minutes.
- You want a live screen on the line, not a report on Monday.
- The DIY system works, but only one person understands it.
Two or three of these at once is a clear signal. At that point, the time you spend keeping free tools alive may cost more than a paid tool.
Where Fabrico fits
Fabrico is a light MES in the cloud. It takes OEE and downtime from machine data (a PLC, an IoT sensor or a camera) and adds the stop reasons your operators enter.
It is paid software, with a price set for your plant. It has neither a no-cost tier nor a trial period, so there is no self-serve sign-up.
What you get instead:
- A live production line screen with hourly rows, stops and changeovers, and a TV status screen for the shop floor.
- Stop reasons chosen in two quick steps, with unclassified time shown until a reason is added.
- A manual mode for lines that have no sensors yet.
- OEE analytics: top stop reasons, downtime split by type, and trends by shift, day or week.
- Camera-based OEE, where a camera can suggest the stop reason for people to confirm.
A pilot site can be operational in days. See Fabrico MES and OEE for how it works.
Request a demo or Contact us to talk about your lines and get a quote.
What people ask next
Is there truly free OEE software?
Yes, in limited forms: spreadsheet templates, calculators, open-source projects and some vendor free tiers.
None of them is free of effort. Compare them in the table above before you pick one.
Is a spreadsheet good enough for OEE?
For one line and a learning phase, yes. It stops being enough when entry is late, when short stops are missing or when several lines need to be compared.
Start with the OEE calculation guide so your sheet uses the right formula.
How accurate is OEE that people write down by hand?
It is as accurate as the habit of writing everything down. Counts and long stops are usually fine. Short stops are usually under-reported, so availability looks better than it was.
What should I look for in paid OEE software?
Automatic capture from machines, stop reasons that are fast to enter, a live screen, history you can export and a clear quote for your number of lines.
The guide to the best OEE software lists what to compare.
Is Fabrico free, or can I try it for free first?
No. Fabrico is paid software with a price set for each plant. It has neither a no-cost tier nor a trial period.
The way to see it working is a demo on your own lines, as described above.
What should I fix first once I have the numbers?
Start with the biggest source of lost time, not the loudest complaint. Rank stops by total minutes and look at the many short ones separately.
The micro-stops guide shows how to find the small stops that add up.
Next step
Use free tools to learn. When the sheet becomes the bottleneck, talk to us.
Latest from our blog