Login
 Blog
OEE Analytics: How to Analyse OEE Data to Find What to Fix

In short: OEE analytics means splitting your OEE into availability, performance and quality, ranking the losses, and then slicing them by shift, product and hour until one fix stands out.
- First check the data: unclassified time and a wrong ideal rate spoil every chart that follows.
- Split OEE into A, P and Q to see which factor loses the most.
- Rank the losses in a Pareto, by minutes and by how often they happen.
- Cut the data by shift, product and hour, then watch the trend after each fix.
- Compare lines only after you align ideal rates, planned time and product mix.
OEE is the share of your scheduled time spent making good units at the ideal rate.
That one number tells you how a line did. It does not tell you what to fix.
Fixing that gap is the job of OEE analytics: turning the number into a short list of causes, in the order that pays back.
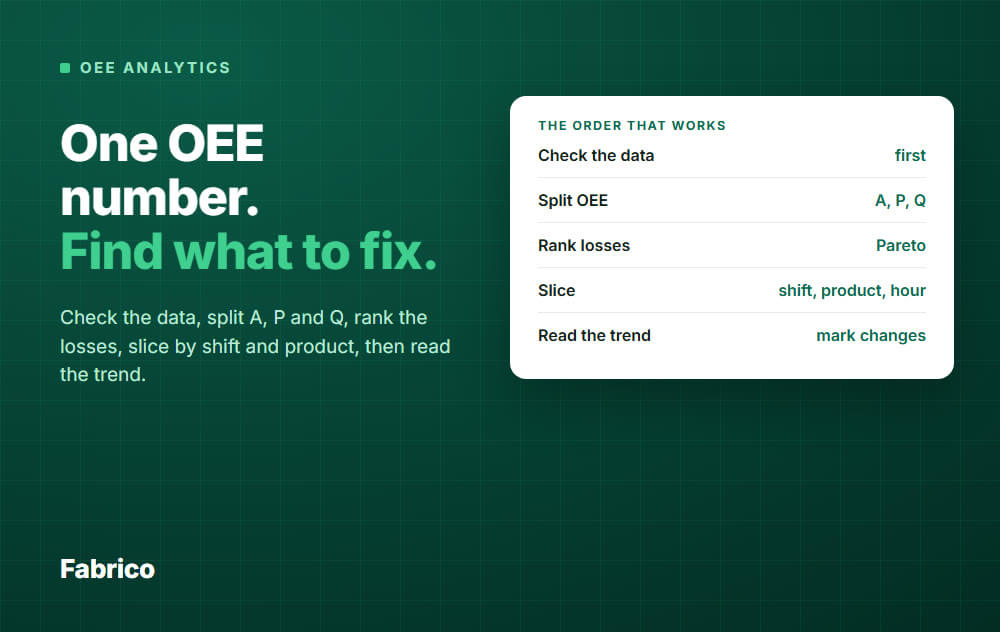
The order that works
Most teams jump straight to charts. A faster route is to ask the same five questions, in the same order, every week.
- Can I trust the data?
- Which factor is losing: availability, performance or quality?
- Which loss reasons are biggest?
- Where and when do they happen: which shift, product, hour?
- Is it getting better after we acted?
The rest of this guide follows those five steps. Start from a reliable OEE number first: see how to calculate OEE if you need the formulas.
Step 1: Check the data before you analyse it
Bad data makes confident, wrong charts. Run three quick checks before you open any report.
- Unclassified time. Stops with no reason cannot be ranked. If it is more than a few percent of downtime, fix the reason capture first.
- The ideal rate. Use the best accredited rate for the product on that line. If performance sits above 100%, the ideal rate is too low.
- Everything adds up. OEE plus all loss percentages should equal 100% of scheduled time. If it does not, a loss is missing.
Also check that planned time is honest. Cutting scheduled time to hide losses makes OEE look good and teaches you nothing.
Step 2: Split OEE into availability, performance and quality
OEE is availability times performance times quality. The product hides which factor is hurting.
A line at 70% OEE could be losing it to stops, to slow running or to scrap. Each one needs a different fix.
Worked example
One 8 hour shift on one line. All numbers are an example.
- Planned production time: 480 min. Stops: 72 min. Run time: 408 min.
- Ideal rate: 60 units per minute. Units made: 20,400. Scrap and rework: 408 units.
Availability = 408 / 480 = 85.0%. Performance = 20,400 / (60 x 408) = 83.3%. Quality = 19,992 / 20,400 = 98.0%.
OEE = 85.0% x 83.3% x 98.0% = 69.4%.
Cross-check with good units only: 19,992 / 60 = 333.2 min of perfect running, and 333.2 / 480 = 69.4%. Same answer, so the data reconciles.
Here availability and speed lose about the same. Quality loses only 1.4 points, so scrap is not where this shift should start.
Where the six big losses fit
The six big losses from TPM (total productive maintenance) sit inside the same three factors.
- Availability: breakdowns, and setup and adjustments.
- Performance: minor stops and idling, and reduced speed.
- Quality: process defects, and reduced yield at start-up.
Use the three factors to find the area. Use the loss reasons to find the cause.
Step 3: Rank the losses
Now list every loss reason with its total minutes and sort from biggest to smallest. That is a Pareto chart, and it tells you where to look first.
A Pareto of downtime usually shows a few reasons carrying most of the minutes.
In this example, one reason is not a machine at all: material wait. Ranking exposes that, a gut feeling would not.
Unclassified is not a cause. It is a data gap, so close it first (step 1).
Planned and unplanned stops
Two bars here are planned: changeover and cleaning. They stay in because they take time out of scheduled time, and 5S and SMED (changeovers in single-digit minutes) can shorten them.
Read them apart from the unplanned bars. An unplanned stop needs a root cause. A planned stop needs a better method.
Cleaning you have planned outside scheduled time is not a loss, so leave it out of this chart. It still shows up in TEEP (see below).
Rank by minutes and by frequency
Do both. A few long stops call for a look at what failed and how long the restart took.
Many short stops call for a look at the pattern: product, shift, setting or material. See micro-stops for how to measure them.
Average stop length per reason is the quick way to tell the two types apart.
Check how your system treats very short stops. Many tools count stops below a set length as lost speed, not downtime, so they will not show in this chart.
Then go one level down
Take the top one or two reasons and split them by machine, product, shift and cause. Stop at the point where you can name one owner and one action.
For the root cause work itself, see equipment downtime analysis.
Step 4: Slice by shift, product and hour
An average hides patterns. The same line can run well on days and badly at night, or well on one product and badly on another.
Cut the same data three ways and look for the group that stands out.
By shift
| Shift (example) | Availability | Performance | Quality | OEE |
|---|---|---|---|---|
| Day | 90% | 88% | 97% | 76.8% |
| Afternoon | 86% | 85% | 97% | 70.9% |
| Night | 78% | 86% | 95% | 63.7% |
Night loses most on availability. Look first at waiting, staffing and support, not at machine speed.
Look at the reasons for that shift only before you decide anything.
By product
Some products often run slower or scrap more. A product split shows whether the loss is the product, the changeover into it, or the line.
It also shows when the ideal rate for a product is wrong, or when a product is simply hard to run.
By hour
An hourly view finds repeating patterns: the first hour after a break, the end of a shift, a cold start on Monday.
A daily total hides these.
Step 5: Read the trend, and mark your changes
One day is noise. Look at weekly OEE and weekly loss shares for at least a month.
Mark every change on the chart: a new ideal rate, a new reason list, a fix you made. Without markers, nobody remembers why the line moved.
After a fix, check two things: did the targeted loss shrink, and did another loss grow to take its place? A loss can move instead of disappearing.
TEEP and utilisation: the view outside scheduled time
OEE only looks at the time you scheduled. TEEP looks at all 24 hours, every day.
TEEP = OEE x the share of calendar time you schedule. Equipment utilisation is the share of the clock the equipment runs.
Example: a line has 69.4% OEE and is scheduled 16 hours of 24. TEEP = 69.4% x 66.7% = 46.3%.
Use OEE to fix losses inside the shifts. Use TEEP when the question is capacity: do we need another shift, or another machine?
Never swap one for the other in a report. They answer different questions.
Comparing lines fairly
Ranking lines by OEE is tempting and often unfair. Before you compare, align four things.
- Ideal rates. Set on the same rule for every line, for example the best accredited rate.
- Planned time. Same rules for what counts as planned and what is excluded.
- Stop reasons. The same reason list, or the comparison is just a comparison of vocabulary.
- Product mix. A line that runs many short orders will show more changeover loss than one that runs long ones.
Combine lines by weighting each one's OEE by its scheduled time. A plain average of percentages is wrong.
Look at the bottleneck line first. A gain there can lift the output of the whole plant. A gain elsewhere may only build stock.
Compare lines on shared losses, not only on the headline number. "Both lines lose 12% to changeovers" is a better lead than "line 2 is 8 points behind".
Common analysis mistakes
- Chasing the percentage. The goal is to remove losses, not to raise a number. Teams that chase the number can start hiding stops.
- Hiding lines in one average. One line at 95% and one at 45% give 70%. That figure describes neither line.
- Looking at minutes only. Many short stops are easy to miss in a total of minutes. Count them too.
- Leaving stops unclassified, or using an "other" reason. It can become the biggest bar and the least useful one.
- Changing the ideal rate silently. The trend then shows a break that is not real.
- Too little data. One shift or one week of one product can mislead. Look for patterns that repeat.
- Treating a high OEE as proof. If OEE looks high but output is short, check the ideal rate and the excluded time first.
What good looks like
A widely quoted benchmark for world class discrete and batch production is 85% OEE. R.C. Hansen gives the same figure in his book on OEE.
It is a benchmark from the industry, not a Fabrico result, and it is not a target for every line. Hansen rates below 65% as unacceptable, and 65 to 75% as passable if the trend is improving.
Compare each line with its own last quarter, and ask whether the top losses are shrinking. A line that moves from 60% to 68% by removing its two biggest losses is doing the work, even if it is nowhere near 85%.
How Fabrico does OEE analytics
Fabrico is a light MES in the cloud. It collects line status and counts from machine data (PLC, IoT sensor or camera), and operators add stop reasons in a few taps.
The OEE analytics screens then work on that data.
- OEE split into availability, performance and quality, plus PA (produced good against the plan), TEEP and equipment utilisation.
- Downtime distribution: planned, unplanned, changeover and unclassified.
- Top 10 unplanned and top 10 planned reasons, and a top 20 stoppages table with downtime, frequency, share and average duration per line.
- Gross production against target, and waste and rework.
- OEE and TEEP over time, split by hour, shift, day, week or month, with exports.
- Group Analytics to see OEE across sites.
Where cameras are enabled, Fabrico can suggest the reason for an unclassified stop, and people confirm it. That helps with the unclassified time problem from step 1.
See Fabrico MES and OEE for the full picture.
Request a demo or Contact us to see your own line data in these views.
What people ask next
Which loss should I fix first?
The biggest one on the bottleneck line, if you can name an owner and an action for it. A smaller loss with an easy fix can go first to build momentum.
How much data do I need before I trust the analysis?
Plan on a few weeks to see patterns by shift and product. Hansen says three to six months of data is enough to work with.
Start the Pareto earlier, but treat it as a guess until the patterns repeat.
What is the difference between OEE analytics and OEE software?
Analytics is the analysis you do. Software collects the data and builds the views. Without automatic data, the analysis is slow and late.
See OEE software for what to compare.
How often should we review OEE data?
Daily at line level for the last shift's top stops, weekly for the trend and loss shares, monthly for TEEP and capacity.
Should I look at OEE or at downtime?
Both, in that order. OEE says how big the gap is. The downtime and loss ranking says what is in it.
For the formulas, see OEE calculation.
Do I need AI or predictive analytics?
Not to start. The five steps above need clean data and a weekly routine, not a model.
Advanced tools only help once stop reasons and ideal rates are reliable.
Ready to see your own line this way? Request a demo or Contact us.
Latest from our blog