Login
 Blog
How to Calculate Machine Downtime: Formulas, Percentage and Examples

In short: Machine downtime is the time a machine was stopped while it was supposed to be running. Add up every stop in minutes, then divide by planned production time to get the downtime percentage.
- Downtime % = stopped minutes ÷ planned production time × 100.
- Split the total into planned and unplanned stops. They have different causes and different owners.
- Downtime % and OEE availability are two views of the same minutes: on the same base, availability = 100% minus downtime %.
- A cost in money is only real if you could have sold the lost output. Otherwise count the extra labour and delay instead.
Most plants "know" their downtime, but two people rarely get the same number.
The reason is not the maths. It is the rules behind it: which minutes count, and what they are divided by.
Below are the formulas, one worked example you can copy, and the rules that keep the number the same from shift to shift.
What counts as machine downtime?
Downtime is any time inside your planned production time when the machine is not making product.
That includes breakdowns, waiting for material, changeovers, cleaning and stops nobody explained.
It does not include time you never planned to produce, such as a weekend with no orders or a shutdown scheduled well ahead.
That time is taken out of the base before you start. The base is the number you divide by.
A simple test for every stop:
- Was this time planned as "no production" well ahead? A week or more is a common rule. Exclude it from the base.
- Is it a normal part of running orders (changeover, planned cleaning)? It is planned downtime, inside the base.
- Did something unplanned stop the line (a jam, no material, a fault)? It is unplanned downtime.
When people say "downtime" or "equipment downtime" without more words, they often mean only the unplanned part. Write down which one you mean.
The downtime formulas
Four formulas cover almost every case.
| What you want | Formula |
|---|---|
| Total downtime (minutes) | Sum of the length of every stop above your short-stop limit |
| Same, by subtraction | Planned production time minus run time |
| Downtime percentage | Downtime ÷ planned production time × 100 |
| Downtime rate per hour | Downtime minutes ÷ planned production hours |
"Downtime rate" means different things in different plants. Most mean the percentage, some mean minutes lost per hour.
Pick one and keep it.
The short-stop limit is explained in the questions at the end. The example below has no stops that short.
Track how often the line stops as well. Five stops of 6 minutes and one stop of 30 minutes give the same total, but they need very different fixes.
Worked example: one shift, step by step
These numbers are an example. Use your own.
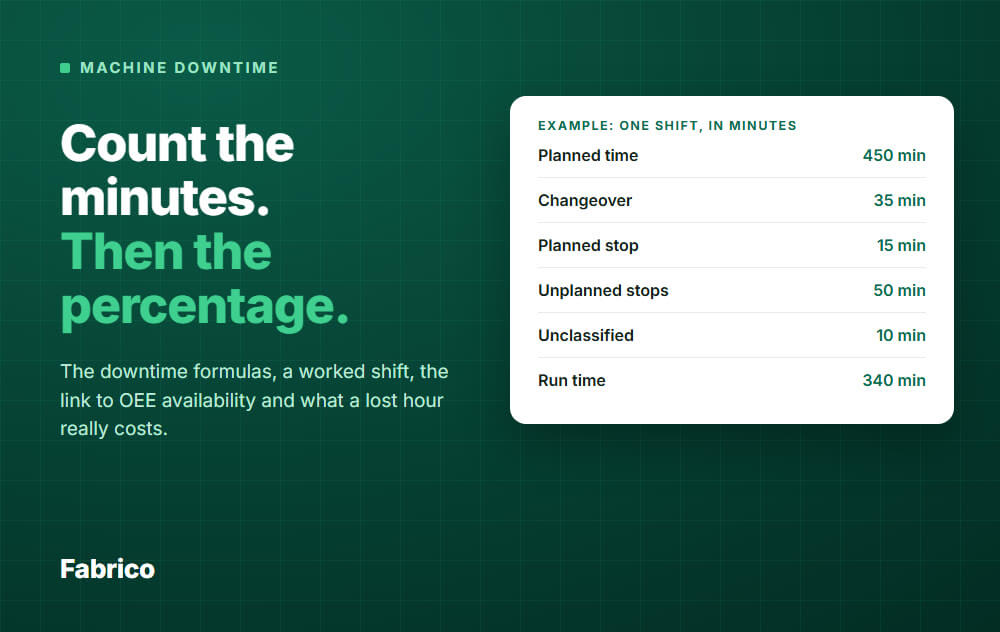
Step 1: set the base. A shift lasts 480 minutes, with a 30 minute lunch break and no production during it.
Planned production time is 480 minus 30 = 450 minutes.
Step 2: list every stop.
| Stop | Type | Minutes |
|---|---|---|
| Changeover to the next product | Planned | 35 |
| Planned cleaning | Planned | 15 |
| Jam at the labeller | Unplanned | 22 |
| Waiting for packaging material | Unplanned | 18 |
| Sensor fault on the filler | Unplanned | 10 |
| Stop with no reason entered | Unclassified | 10 |
| Total downtime | 110 |
Step 3: calculate.
| Measure | Calculation | Result |
|---|---|---|
| Total downtime % | 110 ÷ 450 | 24.4% |
| Planned (changeover and cleaning) | 50 ÷ 450 | 11.1% |
| Unplanned, with a reason | 50 ÷ 450 | 11.1% |
| Unclassified | 10 ÷ 450 | 2.2% |
| Run time share (availability) | (450 minus 110) ÷ 450 = 340 ÷ 450 | 75.6% |
| Downtime rate per hour | 110 ÷ 7.5 hours | 14.7 min per hour |
| Average stop length | 110 ÷ 6 stops | 18.3 min |
Check your work: 11.1% + 11.1% + 2.2% = 24.4%. The parts must add up to the total.
How downtime links to OEE availability
Availability in OEE is run time divided by planned production time. In the example, 340 ÷ 450 = 75.6%.
That is 100% minus the 24.4% downtime. Same minutes, same base, two ways to read them.
So if you already track downtime well, you already have the availability part of OEE. OEE availability explains it in detail.
Slow running is not downtime here. The machine is running, so that loss belongs to performance, not availability.
One note on the base. Some stops, such as a legally required inspection, can be removed from the availability base.
Then downtime % and availability no longer add to 100%. Decide this once, write it down, and apply it everywhere.
Planned vs unplanned: why you split them
Planned downtime (changeovers, cleaning) is part of running the plant. You shorten it with better methods, such as quick changeover work.
Unplanned downtime (jams, faults, missing material, missing operators) is a surprise. You remove it by finding the cause.
If you add both into one number, a long changeover can hide a falling breakdown trend, or the other way round.
Report three numbers: planned, unplanned, and time with no reason yet. The last one shows how much of your data you cannot trust.
Pick the right base to divide by
The same 110 minutes gives different percentages depending on what you divide by.
| Divided by | Calculation | Result |
|---|---|---|
| Planned production time (450 min) | 110 ÷ 450 | 24.4% |
| The whole shift (480 min) | 110 ÷ 480 | 22.9% |
| 24 hours (1,440 min) | 110 ÷ 1,440 | 7.6% |
Use planned production time for downtime and availability. It answers: "When we planned to run, how much did we lose?"
A 24 hour base belongs to a different question: how much of the clock does the machine run? In the example that is 340 ÷ 1,440 = 23.6%.
That is a capacity measure. Dividing downtime by 24 hours only makes the loss look small.
Weeks and months: add minutes, do not average percentages
This error is easy to make, and it changes the number.
| Day | Planned time | Downtime | Downtime % |
|---|---|---|---|
| Monday | 450 min | 110 min | 24.4% |
| Tuesday | 450 min | 40 min | 8.9% |
| Wednesday (half shift) | 225 min | 90 min | 40.0% |
The plain average of the three percentages is 24.4%. That is wrong, because Wednesday was a short day.
The right way: total downtime 240 min ÷ total planned time 1,125 min = 21.3%.
Always sum the minutes first, then divide once.
The cost of downtime, with one big caveat
You can put a price on downtime. But the price depends on one question: could you have sold the output you lost?
Example data: the line makes 120 good units an hour when it runs, and one unit earns a margin of €4 (selling price minus variable cost).
The unplanned stops lasted 50 minutes.
- Lost units = 50 ÷ 60 × 120 = 100 units.
- Lost margin = 100 × €4 = €400.
This €400 is real only if customers would have bought those 100 units and you cannot make them later.
If demand is the limit and you can make the units later, the cost is different: the extra labour and delay to catch up.
For example, 4 operators on overtime for 50 minutes at €30 an hour is 4 × 50 ÷ 60 × €30 = €100.
Never add both numbers. Pick the one that matches your situation, and say which one you used.
Direct costs, such as scrapped product and repair parts, come on top in either case.
Stops on your bottleneck are the ones that most often cost real output. Why lines stop is a field guide to putting a euro value on a stopped hour.
Common mistakes
- Mixing bases. One report divides by the shift, another by 24 hours. The two numbers cannot be compared.
- Counting one stop twice on a line. If the filler stops and the labeller waits, the line lost those minutes once. Count them once, and tag the machine that caused the stop.
- Averaging percentages across days or lines instead of summing minutes.
- Rounded or forgotten stops. Paper logs round to 5 or 10 minutes and skip the short ones.
- A reason called "other". It hides the biggest losses. Every stop needs a real reason.
- Late clocks. The stop starts when the line stops, not when someone notices or arrives.
- Changing the rules mid-month. If you change what counts, restart the trend and note the date.
- Counting time you never scheduled. A machine that sits idle on a Sunday with no orders is not downtime.
How to measure it the same way every time
Five rules are enough:
- One written definition of planned production time per line.
- One written list of planned and unplanned reasons.
- One rule for very short stops (see the questions below).
- The machine signal starts and stops the clock, not a person's memory.
- Unclassified time is shown, not hidden, and reviewed every day.
Hand-timing works for a pilot week. After that, automatic capture wins, because nobody remembers every short stop at the end of a shift.
What good looks like
The number you will often see quoted is 10% downtime or less. It matches the 90% availability inside the classic 85% OEE benchmark, usually credited to Seiichi Nakajima's TPM work.
Treat it as a rule of thumb, not a target. A packaging line and a heavy casting cell lose time in very different ways, and the number moves with your rules.
These signs tell you more:
- The trend for the same line, on the same rules, is falling.
- Unclassified time is a small slice, not a big one.
- Most stops have a specific reason, not a vague one.
- You start with the bottleneck, because a lost minute there is a lost minute for the whole plant.
How Fabrico handles downtime calculation
Fabrico is a light MES in the cloud. It measures downtime and OEE from machine data (a PLC, an IoT sensor or a camera) plus the stop reasons operators enter.
The downtime counter starts when the signal is lost, so the clock does not depend on memory.
If a line has no sensors, a manual mode with quick buttons for the most used reasons covers it.
The app keeps your rules in settings:
- Each stop reason is marked planned or unplanned, and whether it counts in Availability.
- Changeovers are timed against a standard changeover time.
- Time with no reason stays visible as unclassified, and you can split or merge it. With the camera add-on, an unclassified fragment can show a suggested reason that a person confirms.
OEE Analytics shows the split between planned, unplanned, changeover and unclassified time, the top reasons, and a table of the biggest stoppages with downtime, frequency and average duration.
You can view it by hour, shift, day, week or month, and export it.
Fabrico gives you the minutes and the reasons. Those are the inputs for the cost check above, and the same question applies: could you have sold the output?
See the MES and OEE overview for the full set.
Request a demo or Contact us to see your own line's downtime this way.
What people ask next
Does planned downtime count?
Yes, if it happens inside planned production time, such as a changeover. Report it as its own number, so it does not hide unplanned losses.
Time you scheduled as "no production" well ahead is taken out of the base. Planned maintenance follows the same test: taken out of the plan well ahead, it is excluded; eating into time you planned to run, it is planned downtime.
How do I count very short stops?
Choose a limit, for example stops under 5 minutes, and apply it everywhere. Stops below it are usually counted as a performance loss in OEE, not as downtime.
Do not ignore them, because many small stops add up fast. See micro-stops.
How do MTTR and MTBF fit in?
Both use only real failures, not changeovers or waiting for material. In the example that is the jam and the sensor fault: 32 minutes, 2 failures.
MTTR (mean time to repair) = 32 ÷ 2 = 16 minutes. MTBF (mean time between failures) = run time ÷ failures = 340 ÷ 2 = 170 minutes.
One shift is too short for a real MTBF, so use weeks or months of data.
What do I do with time that has no reason?
Keep it as its own category and push it toward zero. Ask operators for a reason while the stop is fresh, and review what is left every day.
Which downtime should I fix first?
Start with the bottleneck. Rank its stops by total minutes, then by how often they happen, then by cost where the output could be sold.
Work on the top two or three. The Pareto guide for downtime shows how to rank them.
How do I get from downtime to OEE?
Downtime gives you availability. Add performance (speed) and quality (good units), then multiply the three.
The steps are in OEE calculation.
Request a demo or Contact us to track downtime on your line without a stopwatch.
Latest from our blog