


 Login
 Blog
Production Reporting Software: What to Check Before You Buy

In short: production reporting software builds your production reports from data taken at the machine, so nobody copies counts and stop times into a spreadsheet at the end of the shift.
- Look for OEE and light MES software, or any system where stops and counts come from the machine and stop reasons from the operator at the line.
- Bring every vendor the same real shift. Eight checks are below.
- Scheduled delivery by e-mail or PDF is one of those checks. Ask each vendor in the demo, including us.
- Fabrico gives you OEE and downtime by line and shift, losses in money, and Excel or CSV export. Production planning and scheduling are not part of Fabrico today.
You already have a production report. It lives in a spreadsheet that someone rebuilds from a stop sheet and a counter reading.
By the time anyone reads it, the shift it describes is long over.
This page is for manufacturing plants, not oil and gas production. It shows what software can take over, what stays with people, and what to ask a vendor about your own data.
We sell Fabrico, so test what we say here like any other vendor's claims.
Which spreadsheet tabs go away, and which don't
A production reporting system does not remove people from the report. It moves them from copying numbers to the few things no signal knows.
| Tab you keep today | What can fill it instead | What a person still does |
|---|---|---|
| Output by shift | Counts from a PLC or a sensor. At manual steps, some products use cameras. | Enters good parts and scrap where nothing counts them |
| Stop log | Start and length of each stop, from the machine signal | Adds the reason at the line |
| OEE calculation | Availability x performance x quality, worked out from times and counts | Agrees planned time and ideal rates, and keeps them current |
| Downtime chart | Stop minutes added up by cause, line and shift | Gives the top loss an owner |
| Handover notes | Nothing. No signal knows this. | The shift leader writes them, as today |
So the first test is simple. After go-live, does anyone still type a count or a stop time into a sheet on a connected machine?
If yes, the old report is still alive.
What production reporting software should show for one shift
Here is a sketch of one line for one shift. It is example data, and it is not a screen from any product.
The math behind the example: availability is 420 of 480 minutes, or 87.5%. Performance is 378 of 420, or 90%. Quality is 360 of 378, or 95.2%.
Multiply them and you get 75%, the same as 360 good minutes of 480. See OEE calculation for the full method.
The reason on the top stop is what makes the page useful. A Pareto of downtime needs it, and a signal alone cannot give it.
Five kinds of production reporting tools, and where their numbers come from
Search for reporting tools and you get five different kinds of product under one name. This is the typical picture, not a rule, so ask each vendor.
| Kind | Where the numbers come from | What to watch |
|---|---|---|
| Excel and whiteboards | People typing or writing | Late numbers, and short stops go missing |
| BI and reporting tools | Whatever you feed them | If a typed sheet feeds them, the weak spot stays |
| ERP reports | Order, labor and material bookings | Strong on orders and cost, often weak on why a line stopped |
| OEE and light MES software | Machine signals plus operator stop reasons | Ask what it leaves to your ERP and planning tools |
| Full MES | Orders and steps, often with machine data | Check where its stop times come from, and the size of the project |
If your main question is where the hours went on line 2 last night, start with the machine data. If it is what a job cost, your ERP probably holds the answer. Labor and material reports usually sit there too.
A full MES and a light MES are different purchases, so settle that before you compare reports.
Eight checks to run in every demo
Run these with every vendor, and with us. Bring a real shift from last week as your test case, and ask how each product would handle it.
Scheduled delivery is the first one, because it is often the first thing a plant manager wants. It is something to check with each vendor in the demo, including us.
| Ask | How to test the answer |
|---|---|
| Does a report go out by e-mail or PDF on a timer? | Ask to see one set up. Note who gets it, in what format, and what happens when a shift overruns. |
| Who builds a new report? | Ask for a view you don't have today. See if your team could make it, or if it becomes a request to the vendor. |
| How do machines add up to a line? | On a line of linked machines, ask whose OEE counts as the line's OEE, and why. |
| Which machine stopped first? | Take one real stop. Ask if the report shows the first machine to stop, and which machines were only starved or blocked. |
| How do lines add up to a plant? | Use the example below, and check the answer by hand. |
| Is there an output target, and where does it come from? | Ask who sets it and where it lives. |
| What happens to a stop with no reason? | Ask to see the row. A report that hides it makes reason data look better than it is. |
| What happens to yesterday's report after an edit? | Ask what happens if one reason changes a day late. Does the report change, and can anyone tell? |
Short stops are worth one more look. Ask where they go, and read our page on micro stops if you are not sure why it matters.
The spreadsheet error to look for: averaged percentages
Here is a mistake that survives the move from Excel if nobody checks. These are example numbers, describing no plant.
One shift, two lines. Line 1 had 420 planned minutes at 80% OEE. Line 2 had 120 planned minutes at 50%, on a short run.
A plain average says 65.0%. Adding the minutes gives 336 + 60 = 396 of 540, or 73.3%. Trust the minutes figure: line 1 ran 3.5 times as long.
Same shift, and an 8.3 point gap that comes from arithmetic alone. Bring this case to every vendor, us included.
For reports on OEE alone, read what OEE reporting software should produce.
What other vendors say about reports
This is what each vendor's own site says, quoted, checked 9 November 2026. It is not a ranking. A gap means only that we did not quote it here, so ask each vendor directly.
| Software | Where the data comes from | On reports and spreadsheets |
|---|---|---|
| MachineMetrics | "Counts come from the spindle, not the clipboard." | "Utilization, OEE, downtime, and setup reports come out of the box." |
| Vorne XL | "Hook up one or two sensors or tap into an existing photo-eye, relay, PLC, or proximity switch." | "Built-in Timeline report depicting Production State, Good Count, and Target Count for an entire Plant." |
| Tulip | "Purpose-built edge hardware connects to machines and sensors directly at the source" | "Replace whiteboards and end-of-shift reports with connected apps that capture data as work happens." |
| TeepTrak | "Sensors detect machine cycles, rates and stops, then a connected box transmits this data to the platform to the second." | "replacing paper logs and spreadsheets with automatic, centralized collection of shop-floor data." |
The MachineMetrics count line is from its home page. For a wider list, see our production monitoring software review.
Where Fabrico fits
Fabrico is a cloud-based OEE and light MES platform. You can see its report screens, from OEE by line and shift to the top stoppages, on our manufacturing analytics and reporting page. Here is what it does.
- Stops: they come from the machine signal. The operator adds the reason.
- OEE and downtime: by line and shift, on the web, iOS and Android.
- Losses: shown in money, not only in minutes.
- Your data: it can leave through the REST API, webhooks or an Excel or CSV export, so your finance sheet can keep running.
- Cameras: AI cameras are an add-on that count parts. You can open the camera video for that minute. In the standard setup it is streamed, not stored in Fabrico.
- Planning and scheduling: not part of Fabrico today. If your morning report needs attainment against a schedule, that stays with your planning tool.
All eight checks above apply to us too. Bring last week's spreadsheet, and ask us which of its tabs we can't fill.
If cameras fit your line, ask us to show them in the demo.
What people ask next
What is the difference between production reporting and production tracking?
Tracking captures events as they happen: counts, stops and rejects with timestamps. Reporting turns them into pages people read. For the capture side, read our guide to production tracking software.
Can reports go out by e-mail or PDF on a timer?
Ask each vendor in the demo, and ask us too. Check the format, who receives it, and what it does when a shift overruns.
Can production reporting software build a daily production report?
That is its basic job. Ask each vendor how yesterday would look, and check that the day matches the shift totals.
Notes and owners for open issues still come from people. For handover tools, see shift handover software.
Can a BI tool do this instead?
A BI tool draws reports from data you feed it, so ask what feeds it. If the answer is a sheet someone types into, the weak spot has not moved.
Fabrico can feed one through Excel or CSV export or the REST API.
Do we still need Excel?
Probably, as an output. Finance often keeps its own model, so the export matters. What should end is typing counts and stop times into it.
What drives the cost of production reporting software?
Each vendor sets its own terms, so give them all the same machine list. Ask what the quote includes: devices, connecting the machines, training and add-ons.
Want to run these checks on us? Book a demo or Contact us.
Related articles


Latest from our blog


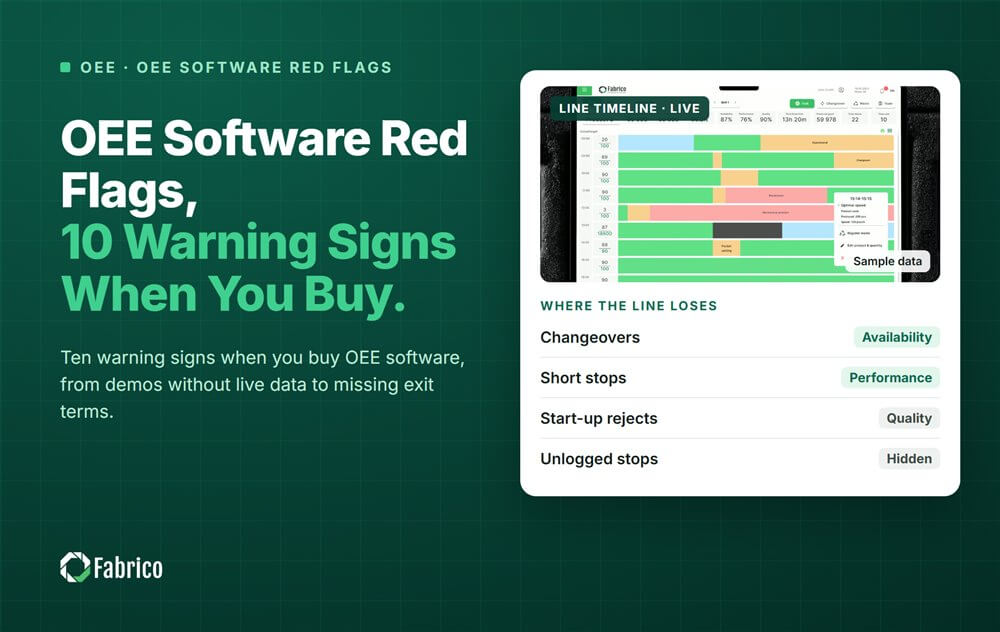
Real Fabrico tiles, sample data.