


 Login
 Blog
Digital Tier Boards vs OEE Software: Which Runs Daily Accountability?

In short: a digital tier board runs daily accountability: the meeting cadence, the actions, the owners and the escalation. OEE software supplies what Tier 1 and Tier 2 should start from: measured losses by line, in minutes and money. A board tool alone is enough when your numbers are already measured. If they are typed from memory, measure first.
- Tier board software manages people and actions. OEE software manages loss data. They answer different questions.
- A board fed by guesses turns Tier 1 into an argument about the numbers.
- Use the three-question test below to pick the board tool, OEE software, or both.
- The simplest wiring: yesterday's top 3 losses by line land on the board before Tier 1 starts.
- A worked example with sample data shows the arithmetic, plus 8 checks for any vendor.
06:45, Tier 1 at line 2. The board says the line lost "about an hour" yesterday. The night shift lead says it was the filler. Maintenance says it was the changeover overrun. Ten minutes later the team has agreed on nothing and assigned nothing. The meeting ran on time. It just had nothing solid to run on.
That is the gap this guide is about. You already know how tiered meetings work; if not, start with our explainer on Tier 1 to Tier 4 board meetings. Here the question is narrower: when you go digital, do you buy tier board software, OEE software, or both, and in which order?
Two jobs, two kinds of software
Digital tier board tools replace the whiteboard. They hold the agenda, the KPI tiles, the action list with owners and dates, and the path an open issue takes from Tier 1 to Tier 2 and up. OEE software sits closer to the machine. It records stops and counts from the line, asks the operator for the reason, and turns that into losses by line and shift.
| Job | Tier board software | OEE software |
|---|---|---|
| Meeting cadence and agenda | Core job | Not its job |
| Actions, owners, due dates | Core job | Some tools; ask |
| Escalation between tiers | Core job | Alerts at most; ask |
| Stops and counts | Typed or imported | From the machine signal |
| Stop reasons | Typed at the board | Tagged at the line |
| Losses in minutes and money | Only if fed | Core job |
| Did the action work? | Only if fed | Trend over weeks |
So "which runs daily accountability?" has a plain answer. The board does. People are accountable in the meeting, not in a database. But accountability for the wrong loss is wasted effort, and that is where the data comes in. For a list of daily management tools by name, see our daily management system software review. For the routine itself, see implementing a daily management system.
Why the board should start from measured losses
The Lean Enterprise Institute puts the purpose simply. In Michael Ballé's words on the Lean Post, the daily management system "is essentially about visualizing problems and making sure we get around to solving them." A board can only visualise the problems it is told about.
Data from real plants shows how much goes untold. A 2016 Chalmers doctoral thesis by Richard Hedman analysed six months of production data from 884 machines at 23 companies, collected by a real-time production follow-up system. Unclassified losses were about 19% of scheduled production time, which was more than half of all recorded loss time. And 702 of the 884 machines (80%) showed a performance rate of 100%. The author judged it unlikely that so many machines really ran at full speed, and noted that 100% was the system's default value for speed. His conclusion: most of the calculated OEE values measured availability, not overall effectiveness.
Two lessons for a tier board follow. First, even with automatic stop capture, half the lost time had no reason. A board that shows a block of downtime with no reason gives Tier 1 nothing to assign. Second, a number that looks measured can still be a default. Before you put OEE on a board, ask how speed and quality are measured, not only uptime. If you want the detail on that, see micro-stops and how OEE is calculated.
Does a disciplined daily routine move OEE at all? Evidence is thin and mostly case-based. One recent field study in the journal Systems tested a daily factory management routine, with problem visibility, a fixed shop-floor cadence, problem solving and tiered escalation, on the bottleneck line of a UK pharmaceutical plant. It was a 19-month, single-site study, and the authors report that "Line OEE increased by over 50% in relative terms." They also say results from one site may not carry over to others. Read it as one sign that a tight routine can move a measured OEE, not as a promise.
Digital tier board or OEE software: how to decide
Pick a tier board tool first if:
- Your Tier 1 numbers already come from measured stops and counts, in a system people trust.
- The meetings happen, but actions get lost, go stale or never reach Tier 2.
- You run several tiers and sites and need one escalation path across them.
Pick OEE software first if:
- Downtime on the board is typed from memory or from a paper log at the end of the shift.
- Tier 1 spends its time arguing about what happened instead of who does what.
- Short stops and slow running never show up, because nobody writes down a two-minute jam.
Do both if:
- Several lines meet daily and Tier 2 and Tier 3 need the same numbers as Tier 1.
- You want to check, week by week, whether a closed action really cut the loss.
| Your situation | Start with | Why | Add next |
|---|---|---|---|
| Board numbers typed from memory | OEE software on the constraint line | The meeting argues about data | Board tool once data is trusted |
| Data measured, actions stall | Tier board tool | Owners and escalation are the gap | Feed losses into it |
| One line, small team, paper works | Keep paper, add measured losses | A board tool would cost more than the problem | Digital board when tiers multiply |
| Several lines, daily Tier 2 and 3 | Both, wired together | Roll-ups need one set of numbers | Weekly check of closed actions |
Want to see measured losses by line, ready for a morning meeting? Book a demo and bring your station list.
How to wire them: yesterday's top 3 losses on the board
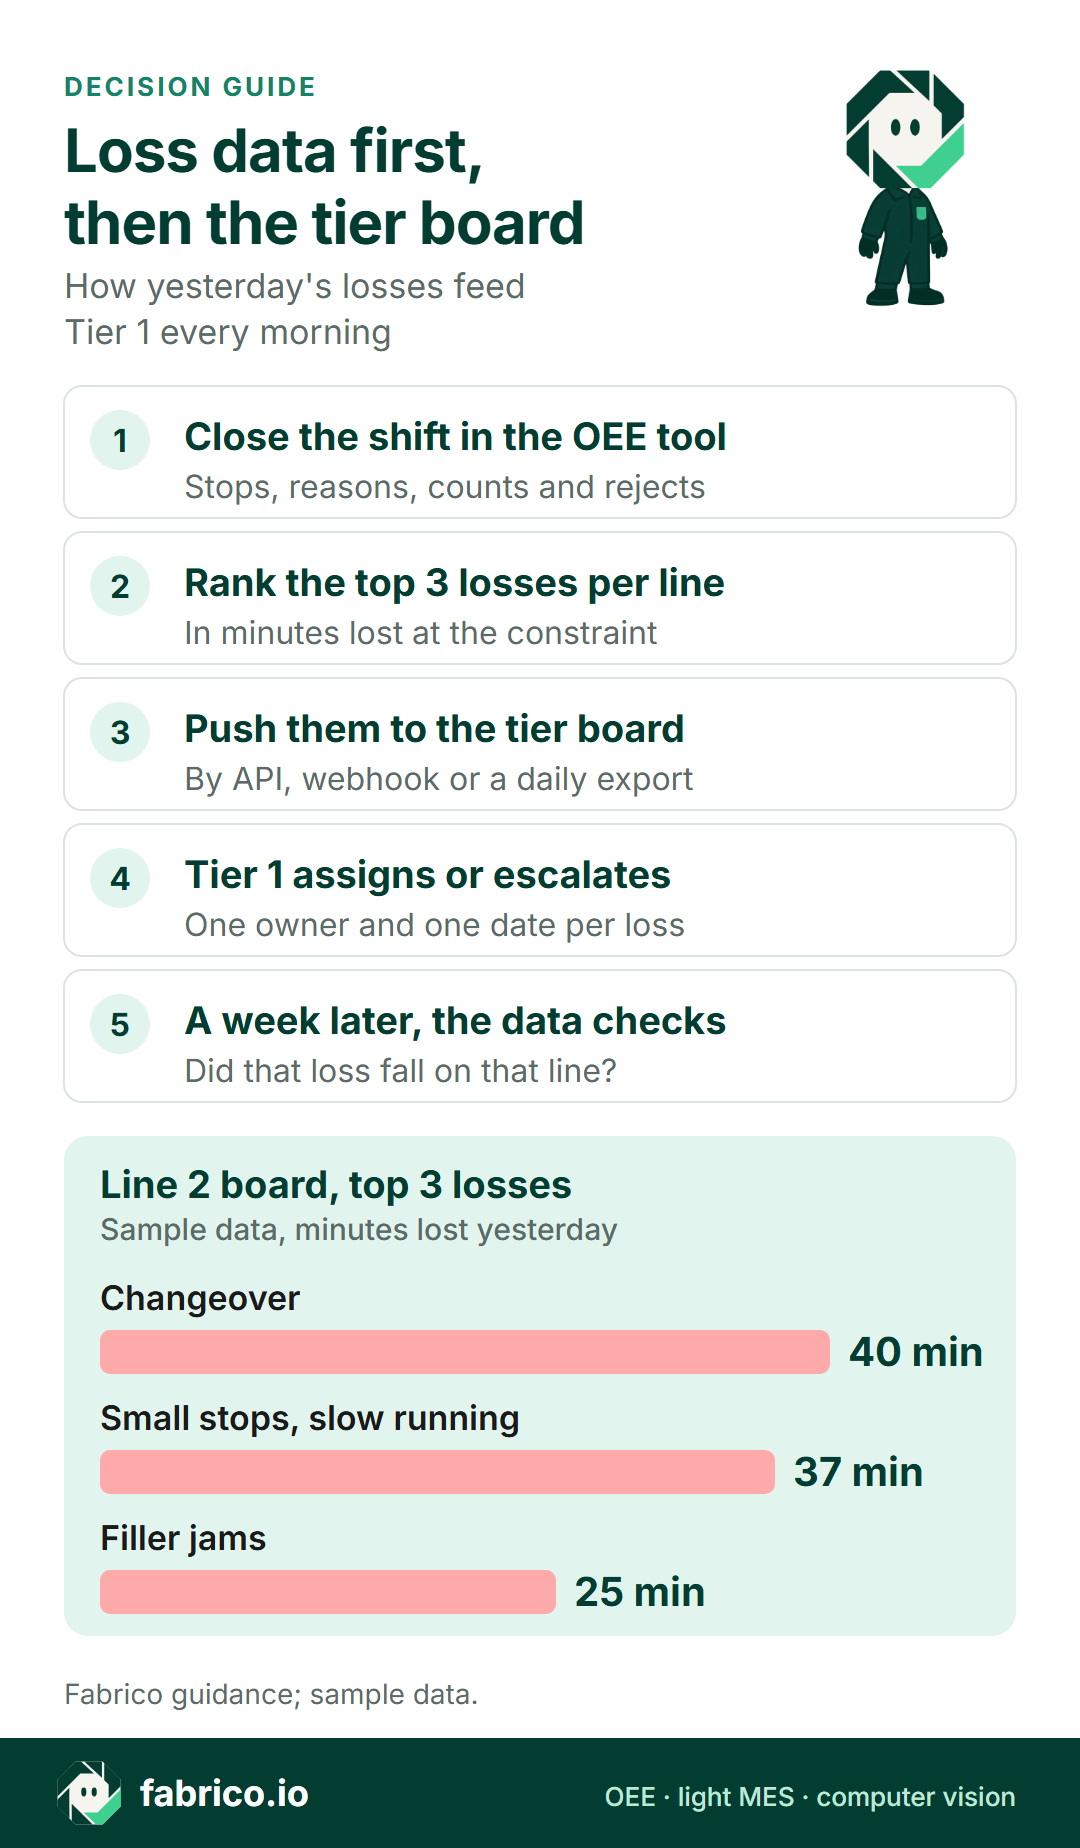
The wiring does not need to be clever. It needs to be the same every morning. A simple routine looks like this:
- Close the shift in the OEE tool. Stops have reasons, counts are in, rejects are booked. Unreasoned stop time is a number on its own, and it goes on the board too.
- Rank losses by line. Take the top 3 by minutes lost at the constraint. Convert to money only with a contribution value finance agrees with.
- Push them to the board. By API, webhook or a scheduled export. The board shows the loss, the minutes and an empty owner field.
- Tier 1 assigns or escalates. One owner and one date per loss. Anything that needs another team moves to Tier 2 with the data attached.
- Let the data check the action. A week later, did that loss fall on that line? If not, the action goes back on the board.
Step 5 is the one most plants skip, and it is the reason to wire the tools at all. A board can show that an action was closed. Only the loss data shows that it worked. The Lean Enterprise Institute's account of tiered huddles at Cleveland Clinic found that connecting the tiers mattered because it "created a method for people to systematically share information". That was a hospital, but the point carries: a shared set of numbers is what lets each tier pick up where the last one stopped.
If several lines report into the same Tier 2, use one loss list for all of them. Different reason lists per line make the roll-up meaningless. For alerting during the shift, which is a different job from the morning review, see our digital andon software review.
Worked example: what Tier 1 sees for one line
Illustrative, sample data. Line 2 packs one product. The filler is the constraint, with an ideal rate of 60 units a minute. Yesterday's shift had 450 minutes of planned production time (480 minutes minus a 30-minute planned break).
- Availability. Recorded stops: changeover 40 minutes, filler jams 25, waiting for material 15. That is 80 minutes down, so run time is 370 minutes. Availability = 370 / 450 = 82.2%.
- Performance. The line counted 19,980 units. At the ideal rate, 370 minutes would give 22,200. Performance = 19,980 / 22,200 = 90.0%. The gap, 370 minus 333 minutes, is 37 minutes of small stops and slow running.
- Quality. 600 rejects, so 19,380 good units. Quality = 19,380 / 19,980 = 97.0%. Those rejects cost 600 / 60 = 10 minutes of the constraint.
- OEE. 82.2% x 90.0% x 97.0% = 71.8%. Check: 19,380 good units / 60 = 323 fully productive minutes, and 323 / 450 = 71.8%.
Now the losses, all in constraint minutes so nothing is counted twice: 40 + 37 + 25 + 15 + 10 = 127 minutes, which is exactly 450 minus 323. The top 3 for the board are the changeover (40), small stops and slow running (37) and filler jams (25). At a sample contribution of EUR 0.10 a unit, those are worth about EUR 240, EUR 222 and EUR 150 of lost output. Without the data, Tier 1 would have heard "about an hour, mostly the filler", and the changeover, the biggest single loss, might not have come up at all.
Questions to put to any vendor, or your own team
Ask the same questions of a tier board vendor, an OEE vendor and your own spreadsheet. The answers show where the gaps are.
- Where does each number on the board come from? Machine signal, import, or typed by a person.
- How much of yesterday's stop time has a reason? Ask to see the unreasoned minutes, not only the reasoned ones.
- How is speed measured? An ideal rate per product, or a default of 100%.
- Can it rank losses by line in minutes and money? And at the constraint, not as a plant average.
- How does a loss become an action? With an owner, a date and the data attached.
- How does an open action move from Tier 1 to Tier 2, and back? Who sees it, and when.
- Can the data check the action? Did that loss fall on that line in the following weeks.
- How does data leave? API, webhooks, export, and who maintains the link when a line changes.
If you are comparing OEE tools on these points, our OEE software comparison and machine monitoring software review list vendors by what their own sites say. For older machines with only a screen, see HMI data collection for OEE. For shift tools that cover work instructions and checklists too, see connected worker platforms.
Where Fabrico fits
Fabrico's documented strength is the data side of this page. It is an OEE software and light MES platform. What its product overview describes today:
- Stops on a connected machine are recorded with start time and duration, from the PLC, a sensor or a counter.
- Operators tag the cause of a stop on a tablet or phone, so downtime by cause builds up shift after shift. Micro-stops are detected from the machine signal.
- The OEE dashboard updates while the line runs, split into availability, performance and quality. Shift results show output, stops and OEE per shift. Losses are shown in money.
- Push, in-app and email notifications follow rules for who is told about what. A technician can open a work order from a stop.
- Data leaves through a REST API, webhooks, Zapier, or an Excel or CSV export, so a board tool you already use can receive the top losses.
- Where a station has no usable signal, the AI camera add-on counts output. Video is streamed on request, not stored by default. Camera-detected stops and camera-suggested stop reasons are roadmap.
If you want the meeting, the actions and the loss data in one tool, ask in the demo how Fabrico handles actions and follow-up today, and test the answer like any vendor's claim. Devices connected in about a month; full rollout in 3 to 4 months. EU customers are hosted on AWS in Frankfurt. For FMCG lines with manual packing steps, our FMCG computer vision guide shows where the camera add-on earns its place. Test our claims like any vendor's.
What people ask next
Can a tier board tool calculate OEE?
Some board tools show OEE if someone types it in or imports it. Ask where each number on the board comes from: a machine signal, an import, or a person filling it in before the meeting. If it is typed, the board is only as good as the shift log.
Do we need OEE software before a digital tier board?
Not always. If your Tier 1 numbers already come from measured stops and counts, a board tool can run the meeting well. If they come from memory or paper, measure the constraint line first, then digitise the board.
Can OEE software replace the tier board?
It can replace the scoreboard part: shift results, losses by line and trends. It does not run the conversation, pick owners or enforce escalation by itself. Many plants keep a simple board or action list and feed it from the OEE data.
How many losses should go on the Tier 1 board?
This guide uses three per line: enough to act on in one shift, few enough to finish. Rank them by minutes lost at the constraint, not by which problem was loudest during the shift.
Can Fabrico feed the tier board we already run?
Fabrico records stops, reasons and counts, shows losses in money and shift results, and sends notifications by rule. Data leaves through a REST API, webhooks, Zapier or an Excel or CSV export, so a board tool can receive the top losses. For how actions and follow-up work inside Fabrico, ask in the demo and test the answer like any vendor's claim.
Want your next Tier 1 to start from measured losses? Book a demo and see it on a line like yours.
Related articles



Latest from our blog



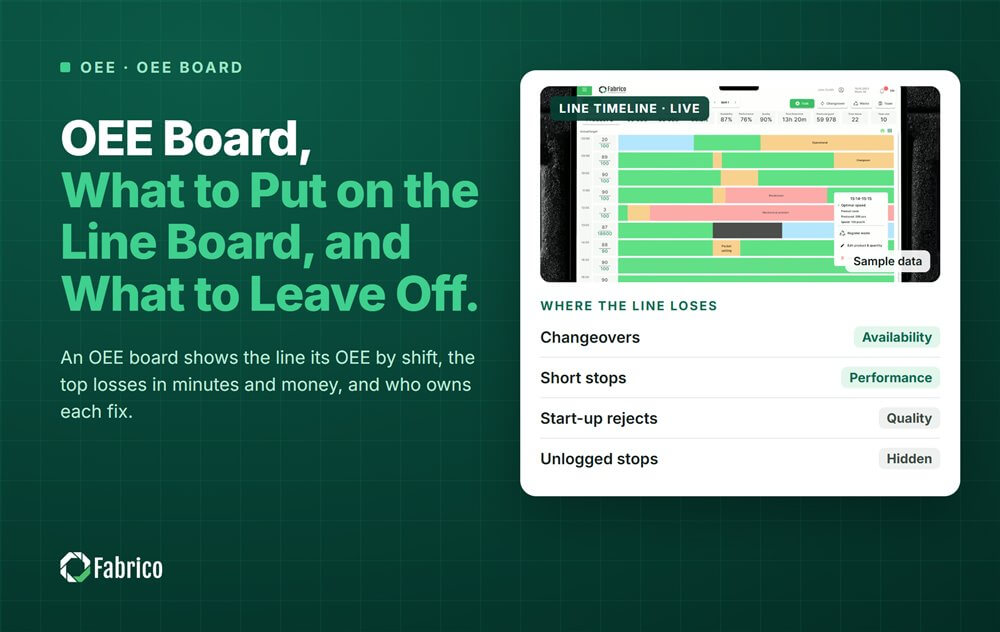
Real Fabrico tiles, sample data.