


 Login
 Blog

Best Machine Monitoring Software for Mixed Plants: 6 Tools, 6 Tests

The shortlist: no single machine monitoring software fits all plants. In a mixed plant, the right pick depends on your hardest machine and on who will run the system.
- No PLC access on most machines: Guidewheel, FourJaw.
- Counted lines, scoreboard at the line: Vorne XL.
- Mostly machine tools, some other equipment: MachineMetrics.
- Your own team builds it: Ignition with Sepasoft.
- PLCs, old machines and manual steps in one OEE view: Fabrico.
Machine monitoring software records when machines run, idle or stop. This page does not cover vibration or condition monitoring.
A mixed plant is hard to shop for. A newer filler, an old press and a hand-packing bench all have to end up in one downtime report.
A demo on your newest machine proves very little. So this page gives you six tools, who should look at each one, what to check first, and one test to run on one machine.
We sell Fabrico, one of the six, so weigh our view with that in mind. The order is not a ranking.
The "what its site says" lines come from each vendor's own site, read on 9 November 2026. Everything else in an entry is our own view. Features change, so check on the vendor's site before you plan around anything here.
Looking for something else? Read how machine monitoring systems work for the basics, or the CNC shortlist if your floor is all machine tools.
Find your row first
Answer these in order for your plant, and stop at the first yes. Then read that tool's entry and the next closest one.
Pick the machine you will test on
Write your machine types in a table like this one. The row with the hardest question is your test machine, and all vendors get the same one.
| Machine (example) | Signal you can get | Hard question |
|---|---|---|
| Newer filling line | PLC data, if the controls owner agrees | Who approves read access, and which data do we read? |
| Old press | No network port, so an added sensor | Can it count strokes, or only see on and off? |
| CNC lathe | Control data, depending on its options | Does it land in the same OEE report as the filler? |
| Hand-packing bench | No machine at all | Who or what counts output, and who enters stops? |
Not all demos can connect a real machine live. If a vendor's cannot, ask to see the closest machine type, then make your test a written condition of the first phase.
Why each tool gets a different test
The signal decides what a tool can see, so the test has to go after the weak spot of that signal. Here is one example hour on one machine, read two ways.
Now add output. Say the ideal rate is 10 units a minute, the slow spell runs at half that, and all units are good. That makes 375 units in the hour (example).
- OEE is 375 of a possible 600 units, or 62.5 percent, whichever signal you use.
- The power reading splits that into about 92 percent Availability and 68 percent Performance.
- The count reading splits it into 75 percent Availability and about 83 percent Performance.
Same hour, different story. This is a basic power reading. Some power-sensor vendors also track cycles, so test yours. On the power reading, a wait for material looks like slow running, so someone may go and fix the wrong thing.
Without a count from somewhere, a sensor, a camera or an operator, you get no Performance figure at all. So in any demo, ask where the count comes from on your test machine.
The six tools at a glance
These machine monitoring solutions for manufacturing start from different signals, and that drives most of what you need to check.
| Tool | Main data route | How a stop reason gets in |
|---|---|---|
| Guidewheel | Sensor on the power conductor | Operator at the line, in a few taps |
| FourJaw | Clip-on sensor on the power cable | Operator picks from a list |
| Vorne XL | Sensor, or a tap into a photo-eye, relay or PLC | Operator: barcode scan, touchscreen or tablet app, by model |
| MachineMetrics | Machine controls, with sensors and IO adapters on older equipment | Operator touchscreen, some automatic |
| Ignition with Sepasoft | Connections your team sets up | Automatic, manual or hybrid collection, set up in your build |
| Fabrico | PLC or IoT sensors. AI cameras (an add-on) count parts | Operator on a tablet or phone |
Source: each vendor's own site, checked 9 November 2026, linked in its entry below. This is not a ranking, and a gap means only that we did not find it on the pages we read, so ask each vendor directly.
Each tool: who should look, what to check, one test
Guidewheel
What its site says: sensors connect to a machine's power conductor and give live run, idle and down data, without making a PLC integration the first step. It says the system times detected events whether or not a reason is entered, and operators add the reason in a few taps and record scrap at the line. It lists plastics and packaging, food and beverage, and steel and metals among its industries.
Look at it if: you have old and new machines and little access to the controls, and you want a first view by machine and plant.
Check first: the starting signal is electrical activity. Its OEE page says it can supply validated machine-state timing, that cycles are tracked against your target so a machine running slow shows up as slow, and that each OEE input should be confirmed per machine. So confirm the count on yours.
Test on one machine: leave it powered with the motors on and no product for 10 minutes. Does the timeline say running or idle? Then log a reason and a scrap entry at the line.
FourJaw
What its site says: you clip sensors to the machine's power cables and connect an IoT device to WiFi and mains power. It says it can monitor almost any mains-powered machine, including mixed fleets, and does not rely on access to the machine PLC. Operators pick a reason from a predefined list.
Look at it if: you run a job shop or a mixed fleet and want running, idle and stopped time with reasons, and no controls project.
Check first: its OEE page says the platform is designed to measure and track Availability and to log and report on Quality. If speed loss is your main question, ask how it shows up.
Test on one machine: run one job at reduced speed for 15 minutes, then a light-load cycle. Ask to see where each one appears in the reports.
Vorne XL
What its site says: XL is a standalone device with I/O, an operator scoreboard and built-in reports. You hook up one or two sensors or tap into an existing photo-eye, relay, PLC or proximity switch. Your data is stored behind your firewall. Operators add a stop reason by barcode scanner, touchscreen or tablet app, depending on the model.
Look at it if: your lines give a clean count or cycle, your team wants a scoreboard at the line, and your IT team wants the data on site.
Check first: Vorne says it drops into any process that provides counts or cycles, so that is the condition to check on each machine type.
Test on one machine: time an operator entering a reason during a real stop, gloves on. Then ask what you would do on your machine type with the least clear count.
MachineMetrics
What its site says: purpose-built for discrete manufacturing. Modern controls read natively, older equipment connects through sensors and IO adapters, and the model reaches past CNCs to compressors and chillers. Operators categorize downtime on a touchscreen at the machine, and some events are categorized from machine data.
Look at it if: yours is a metalworking plant led by machine tools, with stamping, grinding or other discrete equipment beside them.
Check first: if your mix leans toward fillers or process lines, ask for an example from a process like yours.
Test on one machine: use your test machine. If it is a CNC, add your least CNC-like machine. Ask to see it next to a machine tool in the same OEE report, then see what an operator is asked after a stop with no automatic category.
Ignition with Sepasoft
What their sites say: Ignition is server software that acts as a hub for the plant floor, with a designer for building your own applications, on technologies such as SQL, Python, OPC UA and MQTT. Sepasoft's OEE Downtime Module is built on Ignition and collects production counts, cycle times and downtime events.
Look at it if: you have controls engineers or a trusted integrator, and you want your own screens and data model.
Check first: a platform you build on is a build you own. Name who makes it, and who changes it when a machine or a product is added.
Test on one machine: ask the integrator to show OEE for one machine from its raw signals. Then have them change a stop reason and an ideal cycle time while you watch, and note who had to do it.
Fabrico
What it is: a light MES for OEE, downtime and line performance. Machine data comes from a PLC, or from a Fabrico IoT device with external sensors on older machines. AI cameras (an add-on) count parts at stations with no machine signal.
One plant can mix all three, and each source feeds the same OEE calculation. Protocols are OPC UA, Modbus, PROFIBUS, PROFINET, MQTT, EtherNet/IP, EtherCAT, IO-Link and HTTP.
Stops come from the machine signal, and the operator adds the reason on a tablet or phone from your own list. Short stops book as Performance. Where no signal or sensor carries it, operators also add good parts and scrap by hand.
A manual station has no machine signal to time a stop, so ask us to show how stops are handled there.
Where an AI camera (an add-on) is installed, you can open its video for that minute. In the standard setup the video is streamed, not stored in Fabrico. The camera does not explain the stop. Suggested stop reasons are on our roadmap, not in the product today.
Maintenance is a side benefit: a work order is opened from the stop in one step, linked to the line.
Look at it if: you have PLC lines, older machines and manual stations, and you want OEE by machine, line and shift in one view.
What you give up:
- Rollout is a project. Installing the devices and connecting the machines takes about one month. Full rollout across the lines you choose takes 3 to 4 months.
- Fabrico is cloud software, hosted on AWS in Frankfurt for EU clients, so the app needs a working connection at the line. The gateway can store machine data offline for up to 30 days, with automatic recovery within 72 hours by default.
- Production scheduling is on our roadmap, not in the product today. Job dispatching, BOMs, routings and genealogy stay in your ERP.
- It has no formal root cause workflow. It gives you stop data to start from.
What to test in the demo: our demo runs on a demonstration plant with lines like yours. So bring the row from your table with the hardest question, and ask us to name the route for it. Then ask to see a short stop in Performance, a reason added by an operator, and what the operator sees when the link drops.
If that is the test you want to run, Book a demo or Contact us with your machine list.
Machine monitoring software for small manufacturers
On a small floor, the person who restarts the machine is often the person who has to enter the stop. So count people before you count features.
Three questions matter more at 5 or 10 machines than at 100:
- Who owns it next year? With no IT or controls person, ask who changes a reason list or adds a machine, and how long that takes.
- What does the first machine need? Ask for the hardware, network and power list for your hardest machine, and who fits it.
- What does the second machine add? Ask how the quote changes as you add machines, so you can start small and see the cost of growing.
FourJaw says it helps whether you run a small job shop or a global production facility.
A platform you build on needs someone to build it, so a small team should name that person first.
For Fabrico, be honest with yourself about scope. If you only want running or stopped on a few machines, a rollout project may be more than you need, and the sensor-first tools above are worth testing first. Fabrico makes more sense when you want OEE and stop reasons across PLC machines, old machines and manual stations.
Quoted per plant. Start with a one-line pilot.
Machine monitoring dashboards: what to check
Every machine monitoring software dashboard looks good on the vendor's data. These checks tell you whether the screen will still be useful at 3 in the morning.
- Is it really real-time? Real-time machine monitoring software is a claim you can time. Stop a machine, start a stopwatch and see when the floor screen changes.
- Does an open stop show? The screen should show that a machine is down, for how long, and whether anyone has added a reason.
- Do the numbers agree? Compare the floor screen, the manager's view and the shift report for the same shift. Different OEE on each means different rules.
- Who can change it? Ask whether your team can change a screen, or whether it takes a ticket.
Vendors show this differently. Vorne says any size TV or monitor can act as an operator scoreboard. MachineMetrics says its shop floor dashboard is often installed on monitors at each cell. Sepasoft describes real-time custom dashboards tailored to your company.

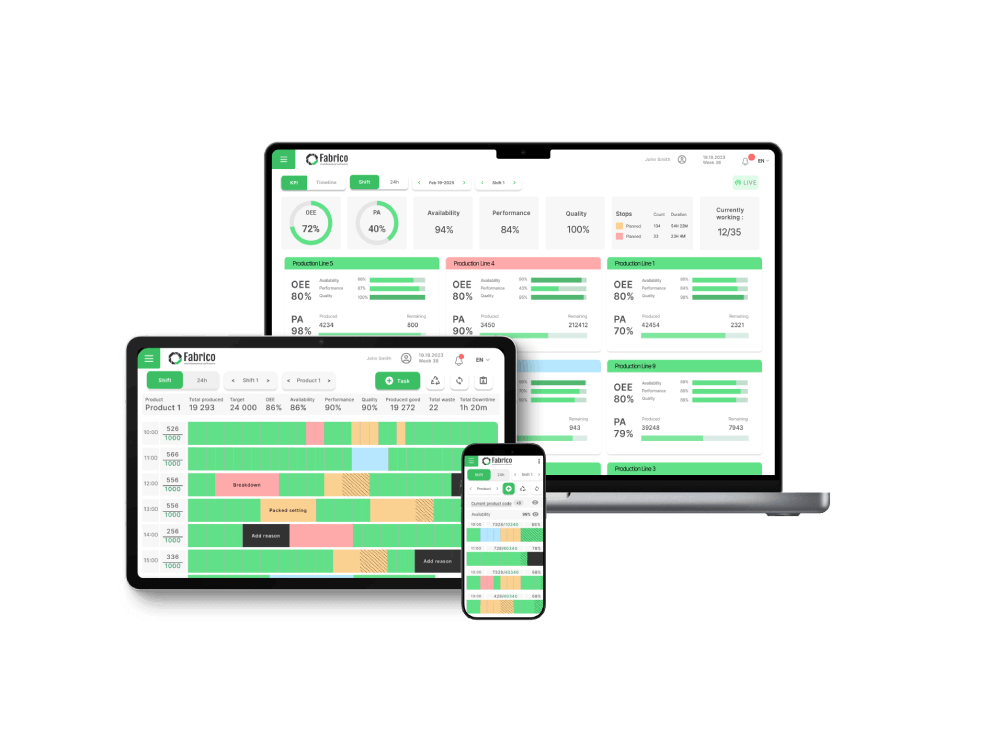
In Fabrico, the dashboards show OEE by machine, line and shift, split into Availability, Performance and Quality, on the web, iOS and Android. Dashboards are set up for the company as a whole, not person by person.
For more on what each person should see, and for BI tools and app platforms, read our manufacturing dashboard software comparison.
Write down what you saw
Fill in one line per vendor, right after the demo, on the same machine type. Memory favors the best presenter.
| Write down | Why it matters |
|---|---|
| Route named for your machine | A promise to connect is not a route |
| Where the count came from | No real count, no Performance figure |
| Where the weak spot showed | This is the test named in that tool's entry |
| Who enters the reason, and how | Stops with no reason are hard to act on |
| Who changes it later | New machines and products keep coming |
For more checks on whether the data is truly live, and more tools aimed at line-level tracking, read our production monitoring software review.
Our list of production monitoring systems compares tools by data source, and its mix includes wider MES platforms.
What people ask next
What is the best machine monitoring software?
There is no single answer, and be wary of a list that gives one. The fit depends on your signals, your line types and who runs the system. Use the path above, then let the test decide.
Can one system cover PLC machines, old machines and manual stations?
Several vendors say they cover old and new machines. Manual stations are where to press hardest, so ask each one who or what counts output there.
Do cameras tell you why a machine stopped?
Not in Fabrico. The AI camera (an add-on) counts parts, stops come from the machine signal, and the operator adds the reason. You can open the camera video for that minute and look for yourself.
Is machine monitoring enough, or do we need an MES?
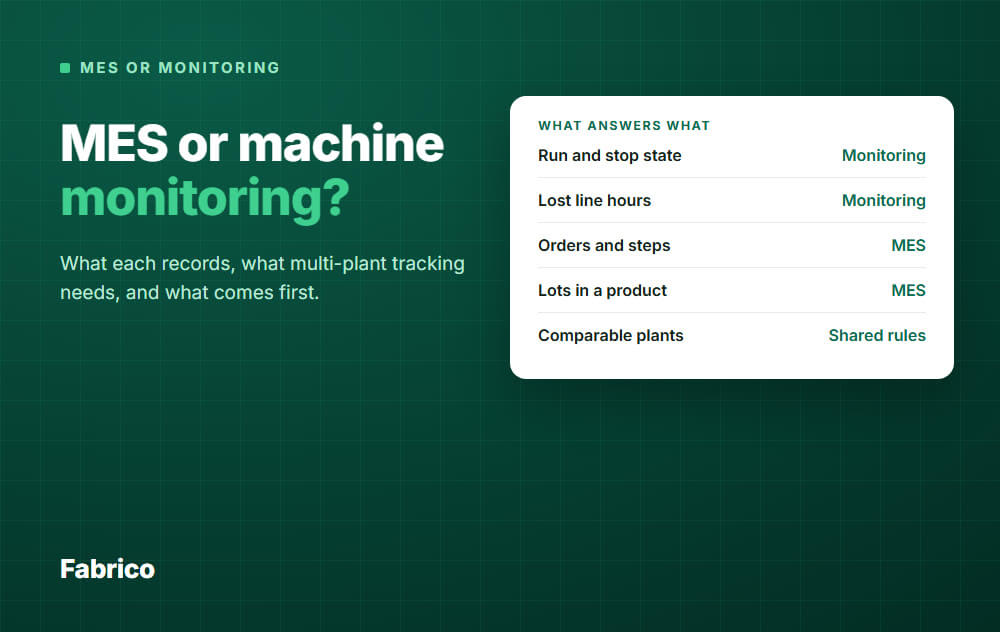
It depends on whether your problem is lost hours or order and lot control. Our guide on MES vs machine monitoring helps you settle it plant by plant.
How long does it take to go live?
Ask each vendor what "live" means, and on how many machines. Here is the answer for Fabrico. Installing the devices and connecting the machines takes about one month. Full rollout across the lines you choose takes 3 to 4 months.
What does machine monitoring cost?
This page gives no vendor prices. Give each vendor the same machine list, and ask for software, hardware and installation as separate lines. For Fabrico: Quoted per plant. Start with a one-line pilot.
Got your hardest machine picked out? Book a demo to see Fabrico on lines like yours, or Contact us and bring that row.
Related articles

Latest from our blog





Real Fabrico tiles, sample data.