






 Login
 Blog
OEE Board: What to Put on the Line Board, and What to Leave Off

Key takeaways
- A good OEE board answers three questions: how did we do, what stopped us, who fixes it.
- Show OEE by shift against the line's own target, not a plant average.
- Show the top three losses in minutes and in money, each with an owner and a date.
- Keep people off the board: OEE by line and shift, never by named operator.
- A live screen and a whiteboard do different jobs. Most lines need both.
Five blocks are enough: OEE by shift, the split into three factors, the top three losses in money, actions with owners, and escalations.
Fabrico, OEE and light MES software with AI cameras, fills the screen part of an OEE board with stops logged automatically from the machines. This guide covers what belongs on a tier 1 OEE board, what to leave off, and a sample board you can copy.
What is an OEE board for?
An OEE board is the meeting point for the tier 1 meeting. That is the line team, at the line, for 10 to 15 minutes at the start of the shift. It is not a report for head office. It is a tool for the people who can fix the next stop.
The idea is old. In the Toyota Production System, when equipment stops, the andon lights up, to notify workers of the abnormality. An OEE board does the same job for the last shift: it makes the abnormal visible, so someone acts on it.
If you already run an hour by hour board, the OEE board sits next to it. The hour by hour board tracks output against plan during the shift. The OEE board explains where the lost time went.
What should an OEE board show?
Keep it to five blocks. If a block does not lead to an action, take it off.
- OEE by shift for the last 24 hours, against the line's own target.
- The split: Availability, Performance and Quality, so the team sees which factor fell.
- The top three losses in minutes and in money, with their reasons.
- Actions: one owner, one date, one line of text per loss.
- Escalations: what the line cannot fix alone and has passed to the tier 2 meeting.
Money matters on the board because minutes mislead. Ten minutes on the bottleneck cost far more than ten minutes on a machine the buffer protects. Leaders who want the plant view should read the five OEE numbers plant leaders need on the wall.
What should stay off the OEE board?
- Operator names next to numbers. Measure the process, never the person. A board that ranks people gets fed bad data.
- A plant average. It hides the line in trouble and means nothing to the people at one line.
- Twenty KPIs. If the team cannot read the board in 30 seconds, it will stop reading it.
- Old data. A board updated once a week is a poster, not a board.
The point about people is not soft. Amy Edmondson's 1999 study of 51 work teams in a manufacturing company found that team psychological safety predicted learning behaviour, which predicted performance. Blame kills stop logging. When a stop gets a person's name, the next stop gets written down as "other".
Worked example: what does a tier 1 OEE board look like?
Sample line (illustrative numbers, not a customer): a filling line, three 8 hour shifts, target OEE 70%. The board for Tuesday morning looks like this.
| Shift | OEE | Availability | Performance | Quality |
|---|---|---|---|---|
| Night | 61% | 78% | 80% | 98% |
| Morning | 72% | 88% | 83% | 99% |
| Afternoon | 70% | 86% | 83% | 98% |
These are the top three losses in the last 24 hours, priced at a sample USD 40 for each minute the filler lost.
- Capper jams: 14 short stops, 31 minutes, USD 1,240. Owner: line lead, check the cap chute guide by Wednesday.
- Changeover to 1 litre: 22 minutes over standard, USD 880. Owner: shift lead, compare with the morning crew's method.
- Waiting for material on night shift: 18 minutes, USD 720. Escalated to tier 2: material call times at night.
The team reads the board in under a minute. Night shift fell on Availability, so the talk is about the night material wait, not about effort. The capper jams are small one by one, but together they are the biggest loss.
Should the OEE board be a whiteboard or a live screen?
Use both, for different jobs.
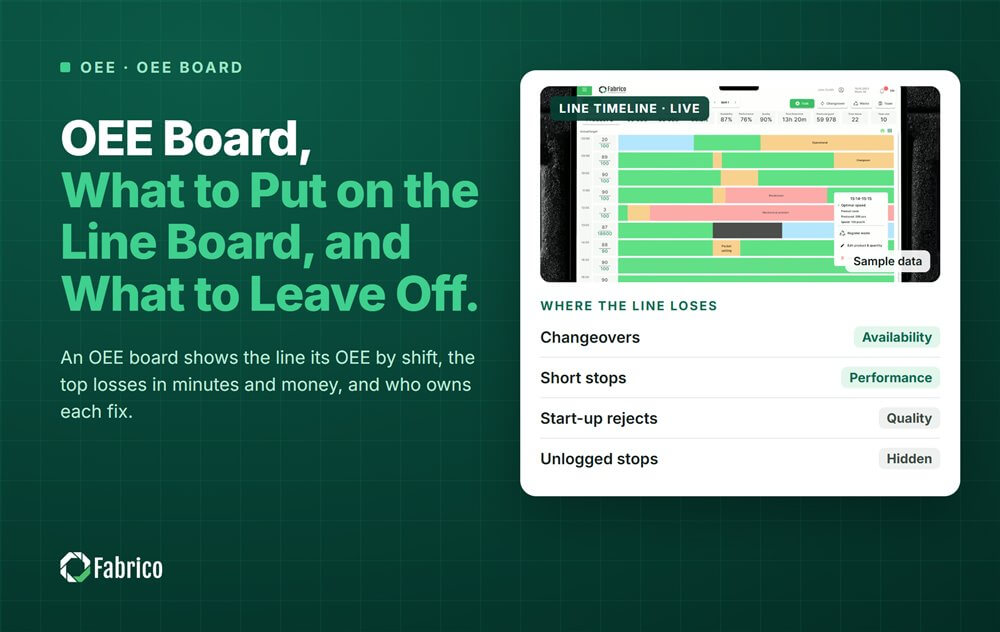
- A live screen shows OEE and stops as they happen. It needs machine data, because nobody can type fast enough to keep it current.
- A whiteboard holds the actions, written by hand by the people who own them. Handwriting makes people commit.
A screen alone becomes wallpaper. A whiteboard alone shows numbers someone copied at the end of the shift, which is memory, not data.
How does the board connect to the tier 2 meeting?
The tier 1 board handles what the line can fix itself. Everything else moves up with its minutes and money attached: a material call time, a spare part, a design fault.
The tier 2 meeting, with the production manager, maintenance and quality, sees the escalations from every line. It decides, gives a date, and the answer comes back to the line board. If an escalation sits for two weeks, the board should show it in red.
How do you keep the OEE board honest?
A board is only as good as the definitions under it. Three habits keep it honest:
- Agree what counts as planned and unplanned time, and write it down. Our guide on downtime definitions that keep OEE honest has a template.
- Watch for the three classic fudges Christoph Roser describes. Breakdowns get booked as planned stops, a good day's speed becomes the ideal, and rework counts as good.
- Never pay bonuses on the OEE number alone. A target on the number invites gaming, as our article on OEE as a vanity metric shows.
Where does Fabrico fit?
Fabrico is a computer vision enabled Manufacturing Performance Platform. It logs stops automatically from the machine signal, prices each loss in money and ranks the losses by what they cost. OEE is live by line and shift, so the screen part of the board fills itself.
The operator confirms the reason in one tap, and where a camera is fitted, a clip is kept as evidence for the stop. Start with one line; our light MES guide explains what that covers.
There is no free plan and there are no tiers: each plant gets a quote.
Frequently asked questions
What is an OEE board?
An OEE board is a visual board at the line. It shows OEE by shift, the three factors, the top losses with their reasons, and the actions with owners. The line team uses it in a short meeting at the start of each shift to decide what to fix first.
How many KPIs should a tier 1 board have?
As few as the team can act on. OEE by shift, the three factors, the top three losses and the open actions are usually enough. If the team cannot read the board in about 30 seconds, it has too much on it and people will stop looking.
Should operators be named on the OEE board?
No. Show OEE by line and shift, never by named operator. Naming people turns the board into a scorecard and teaches people to hide stops. Names belong only next to actions, where a person has agreed to own a fix by a date.
How often should an OEE board be updated?
The OEE and loss blocks should update at least every shift, ideally live from the machines. The action block changes in the tier 1 meeting itself. A board that is updated once a week is too old for the people at the line to act on.
What is the difference between an OEE board and an OEE dashboard?
A dashboard is a screen anyone can open. A board is a meeting tool at the line, with actions and owners written on it. Many plants show the live dashboard on a screen beside the whiteboard, so the numbers and the actions sit together.
Build your OEE board on live data
Bring one line and last week's stop log. We will show what its board would look like with stops from the machine and losses in money.
Latest from our blog


Real Fabrico tiles, sample data.