


 Login
 Blog

Scheduling Software or OEE Software: Which Should Come First?

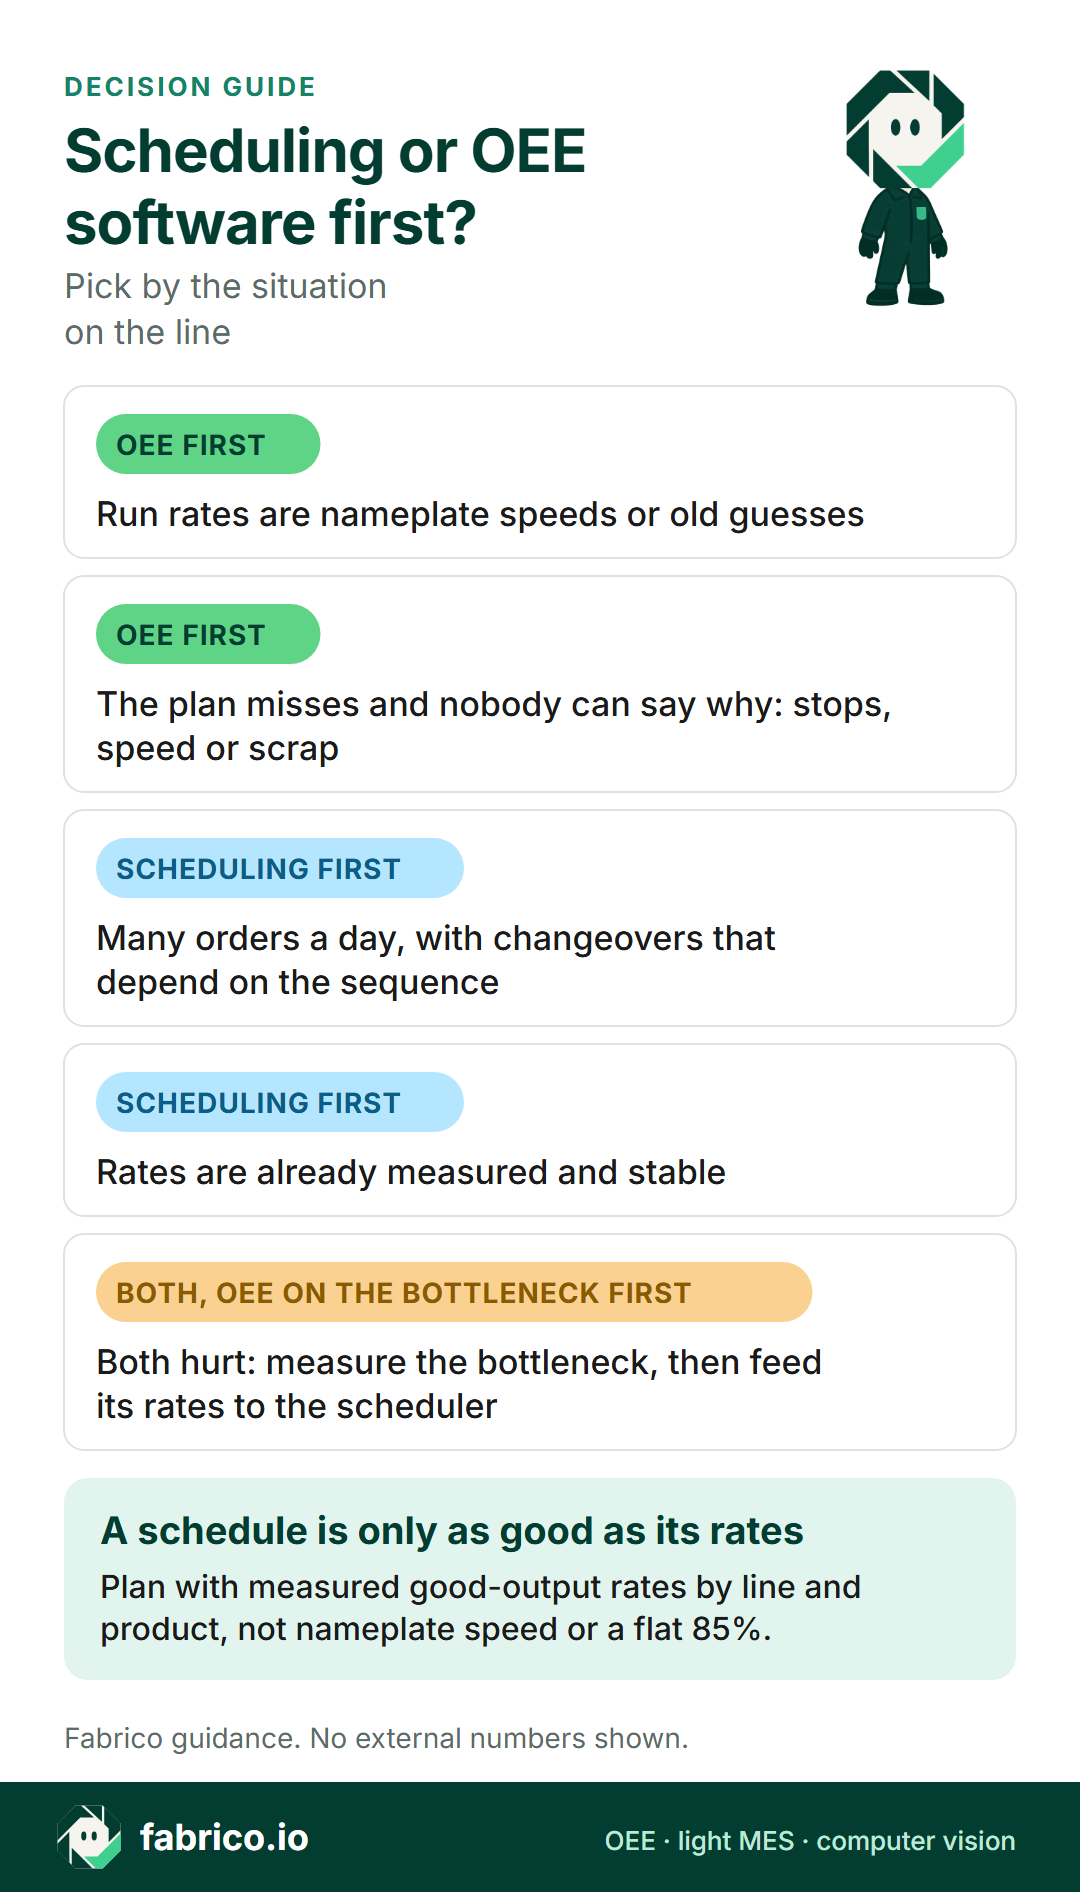
In short: For most plants, OEE software should come before production scheduling software, because a schedule is only as good as the run rates and availability it assumes. Scheduling software first makes sense when you have many orders, changeovers that depend on the sequence, and rates you already measure and trust.
- Scheduling software (APS) decides what runs when. OEE software measures how long and how fast lines actually run, and how much comes out good.
- A scheduler fed nameplate speeds or a flat 85% factor promises output the line cannot make.
- In our sample week, planning at 85% when the line runs at 68.6% OEE leaves 4 of 20 orders unfinished.
- Pick scheduling first when sequencing, not rates, is the hard part. When both hurt, start OEE on the bottleneck.
Two software projects sit on the list, and there is budget for one this year. One is a scheduling tool to end the daily re-planning in spreadsheets. The other is OEE software to see why lines run short. Both promise more output. They get there in different ways.
This guide is for plant managers, planners and CI leads deciding the order. It shows what each tool needs from the other, what a wrong run rate does to a schedule, and a decision table. If you are still sorting MRP from APS, start with MRP vs APS. If your question is how to report plan attainment next to OEE, see OEE vs schedule attainment.
We sell Fabrico, OEE and light MES software. We do not sell scheduling software. Test what we say like any vendor's claims.
Production scheduling software vs OEE software: what each one answers
Scheduling software, often called APS (advanced planning and scheduling), puts orders in sequence on lines against finite capacity, shift calendars and changeover rules. OEE software records what the line actually did: when it ran, when and why it stopped, how fast it ran and how much good product came out.
| Question | Scheduling software | OEE software |
|---|---|---|
| Main question | What should run when? | What did the line really do? |
| Looks | Forward: hours to weeks | Back: last shift to last year |
| Key inputs | Orders, rates, changeover times, calendar | Machine signals, counts, stop reasons, ideal rates |
| Main output | A sequence and due-date promises | Availability, performance, quality, losses by cause |
| Main users | Planners | Operators, supervisors, CI, maintenance |
| Goes wrong when | Rate and downtime assumptions are wrong | Stops have no reasons or counts are wrong |
The two meet at one number: the rate at which a line really makes good product, by product. The scheduler uses it. OEE software measures it.
What scheduling software needs from OEE data
Every scheduler turns an order quantity into hours: quantity divided by run rate, plus changeover time. If the rate is the nameplate speed, or nameplate times a flat factor someone chose years ago, the hours are wrong from the first order.
Measured OEE often sits well below the factors used in plans. In a 2016 Procedia CIRP study from Chalmers, researchers analysed automatically measured OEE data from 23 different companies and 884 machines. The average OEE was 65%. That is one data set from machine-level measurement, not an FMCG benchmark, but it shows how far real equipment can sit from the 85% world-class figure (usually traced to Nakajima's TPM work) that some plans still use.
Changeover times are the second blind spot. Ali Allahverdi's third survey of scheduling with setup times (European Journal of Operational Research, 2015) notes that more than 90 percent of the scheduling literature ignores setup times and costs. A good scheduler lets you enter changeover times by product pair, but it only knows the durations you type in. Measured changeover times are OEE data.
Third, plans meet the floor. Vieira, Herrmann and Lin's framework paper on rescheduling (Journal of Scheduling, 2003) puts it plainly: "Rescheduling updates an existing production schedule in response to disruptions or other changes." Stops nobody measured are disruptions nobody can plan around, so the planner re-plans by hand.
So a scheduler needs three layers of truth about a line: availability (how much of planned time it runs), performance (how fast it runs when it runs) and quality (how much of the output is good). OEE multiplies the three, so the ideal rate times OEE is the good-output rate a plan can count on.
Worked example: planned rate vs measured rate
Illustrative, sample data. A packing line has an ideal rate of 120 packs a minute on its main format, set by its slowest machine, the case packer. Next week has 10 shifts of 450 planned minutes, so 4,500 minutes. The scheduler uses the ideal rate times an 85% factor: 102 good packs a minute. It loads 20 orders of 22,500 packs, 450,000 packs in all, against a calculated capacity of 459,000. The week looks 98% loaded.
OEE data from the last 8 weeks on the same line says something else: availability 80.0%, performance 87.5%, quality 98.0%. OEE = 0.800 × 0.875 × 0.980 = 68.6%. So the line makes 120 × 0.686 = 82.3 good packs a minute, not 102.
| Step | Plan at 85% | Measured, 68.6% OEE |
|---|---|---|
| Good packs a minute | 102.0 | 82.3 |
| Good packs in 4,500 min | 459,000 | 370,440 |
| Minutes per order of 22,500 | 221 | 273 |
| Orders finished in the week | 20 of 20 | 16 of 20 |
| Expected attainment | 100% | 82.3% |
The gap is 79,560 packs: about 966 minutes at the measured rate, a bit over two shifts. Each order runs about 53 minutes longer than planned, and the delay adds up through the week. The schedule was overloaded from the first shift, and nobody could see it.
The losses reconcile, as they should. Of the 4,500 planned minutes, 3,087 are good output at the ideal rate (OEE 68.6%), 900 are stops (20.0%), 450 are slow running (10.0%) and 63 are rejects (1.4%). The four add up to 100%. That split tells the planner how much slack to plan, and tells the CI team what to fix first.
Two fixes follow. Plan at 82 packs a minute and the schedule tells the truth: 16 orders this week, or about 966 extra minutes, a bit over two shifts, to finish all 20. Then work on the 900 stop minutes, because each point of availability won back goes straight into the plan.
Rates also differ by product. If one format runs at 90% performance and another at 75%, a line average hides both. The scheduler needs a rate per line and per product or format. Our OEE calculation guide has the formulas.
Which should come first? Pick by situation
Pick OEE software first if
- Your run rates are nameplate speeds or old estimates.
- The plan misses and nobody can say whether stops, slow running or scrap caused it.
- One bottleneck line sets the plant's output, and you do not know its real rate.
- Planners cope in a spreadsheet, but promises keep slipping.
Pick scheduling software first if
- You run many orders a day with changeovers that depend on the sequence, such as colour, allergen or size order.
- Your rates are already measured and stable, from a historian, an MES or careful time studies.
- Planners spend hours a day re-sequencing, and the floor hits the plan when the sequence is right.
- The cost sits in late orders and stock, not in line losses.
The same sample line, from the scheduling side. Say it makes 12 changeovers a week at 30 minutes each: 360 of its 900 stop minutes. A better sequence that halved them would win back 180 minutes, against the 966 minutes the rate gap costs. On this line, OEE work comes first. On a line with 40 changeovers a week at 45 minutes each, 1,800 minutes, halving them is worth 900 minutes, close to the rate fix, and scheduling first can make sense.
Do both if
Both hurt. Then start OEE on the bottleneck, collect a few weeks of rates and changeover times, and hand them to the scheduler when it starts. A scheduler fed measured inputs starts from a plan people believe.
| Situation | Start with | Why |
|---|---|---|
| Rates are guesses | OEE software | A scheduler multiplies a wrong rate |
| Plan misses, cause unknown | OEE software | You need the loss split first |
| Many orders, sequence-based changeovers, rates known | Scheduling software | Sequencing is the hard part |
| One bottleneck limits output | OEE on that line | Its rate sets the whole plan |
| Few products, long runs | OEE software | Little to sequence; a spreadsheet plan may do |
| Both hurt | OEE on the bottleneck, then scheduling | The scheduler starts with true rates |
Not sure which side your plant is on? Book a demo and bring one week of plan against actual. We will look at the rates with you.
Handing OEE data to the scheduler you pick
You do not need an integration project on day one. The scheduler needs a short list, kept current:
- Good-output rate by line and product: the ideal rate times measured OEE over a recent window, such as the last 4 to 8 weeks.
- Changeover times by product pair: measured, with the typical time and the spread.
- Planned stops: cleaning, breaks and maintenance windows, on the calendar.
- An allowance for unplanned stops: from measured availability, not a round number.
Use the bottleneck's rate for the line. A filler that can do 150 a minute in front of a case packer that can do 120 is a 120 line. Review the rates on a set rhythm, monthly for most plants, and after any change that moves a rate, such as a new format part or a speed-up. A CSV export to the planner works at first; an API link can come later.
For the daily version of this loop, see how real OEE feeds the daily plan. For why plans built on infinite capacity break, see finite vs infinite capacity scheduling.
Questions to ask any vendor, or your own team
Put these to scheduling vendors, OEE vendors (us included) and your own planners.
| Question | Why it matters |
|---|---|
| Where will run rates come from: nameplate, history or live data? | It decides whether the plan is believable. |
| Are rates kept per line and per product or format? | One average hides slow products. |
| How are changeover times entered, and from what data? | Sequence-based changeovers drive the schedule. |
| How does the plan learn about a stop during the shift? | Plans meet disruptions daily. |
| Can losses be split into stops, slow running and rejects? | Planners and CI need different slack. |
| How do rates move from OEE data to the scheduler: export, API or by hand? | Copying by hand goes stale. |
| Who owns the rates, and how often are they reviewed? | Rates drift as lines change. |
| What does the first line ask of planners and operators? | Daily use decides whether either tool works. |
Mistakes to avoid
- Buying a scheduler to fix a line that stops a fifth of the time. It will plan around losses it cannot see.
- Planning with a flat 85%. That figure is a world-class OEE goal, not a planning rate.
- One rate per line for all products. Slow formats then blow the plan on the days they run.
- Stale rates. A speed-up or a new format part changes the rate; the plan has to follow.
- Judging the line on attainment alone. A line can hit a soft plan and still waste capacity.
Where Fabrico fits
Fabrico is a cloud OEE and light MES platform. On this page it sits on the measuring side, not the scheduling side.
- Stops and counts come from the machine signal: a PLC, a sensor or a counter. The operator adds the stop reason at the line, on a tablet or phone.
- OEE, downtime and losses by line and shift, with losses shown in money, on the web, iOS and Android.
- Performance compares actual output with what the ideal cycle time allows, so slow cycles and micro stops show up.
- Your data leaves through a REST API, webhooks and Excel or CSV export, so measured rates can go to a planner, an ERP or a scheduling tool. A connection to SAP or another ERP is scoped per customer.
- Stations with no usable signal: the camera add-on, on request, counts output, and you can open the camera video for any moment on the shift timeline. In the standard setup, video is streamed on request, not stored in Fabrico.
What it does not do: production planning and scheduling are not part of Fabrico today, so Fabrico does not sequence orders.
Roadmap, not live today: stops detected by the camera, and a camera suggesting a stop reason.
Devices connected in about a month; full rollout in 3 to 4 months.
See light MES and OEE in Fabrico for the product, and the computer vision add-on for camera counting. To compare OEE tools, read how to evaluate OEE software, best OEE software and cloud OEE software. For machines without a PLC link, see machine monitoring software. FMCG plants can go on to MES for mid-size FMCG plants or computer vision for FMCG manufacturing. The eight questions above apply to us too.
What people ask next
Should I buy OEE software or scheduling software first?
For most plants, OEE software first, on the bottleneck line, because a schedule is only as good as its rates. Buy scheduling software first when you have many orders, sequence-dependent changeovers and rates you already measure and trust.
Can scheduling software calculate OEE?
OEE needs stop times, stop reasons, counts and an ideal rate from the line. Ask whether the tool records stop times and reasons from the line, or only the quantities reported back to it.
What run rate should a production schedule use?
The good-output rate the line really achieves for that product: the ideal rate times measured OEE over a recent window. Use the bottleneck's rate for the line, and keep separate rates per product or format.
Is 85% OEE a good planning factor?
Rarely. 85% is a world-class goal, not a typical result. A 2016 Chalmers study of automatically measured data from 884 machines in 23 companies found an average OEE of 65%. Plan with your measured figure and raise it as the line improves.
How often should scheduling rates be updated from OEE data?
Monthly suits most plants, plus after any change that moves a rate, such as a speed-up, a new format part or a new product. Live data also helps planners react within the shift.
Does Fabrico do production scheduling?
No. Fabrico measures OEE, downtime and losses, and sends the data out through a REST API, webhooks and Excel or CSV export, so a planner or a scheduling tool can use the rates. If you need scheduling, ask us in the demo.
Want to see measured rates on a line like yours? Book a demo.
Related articles


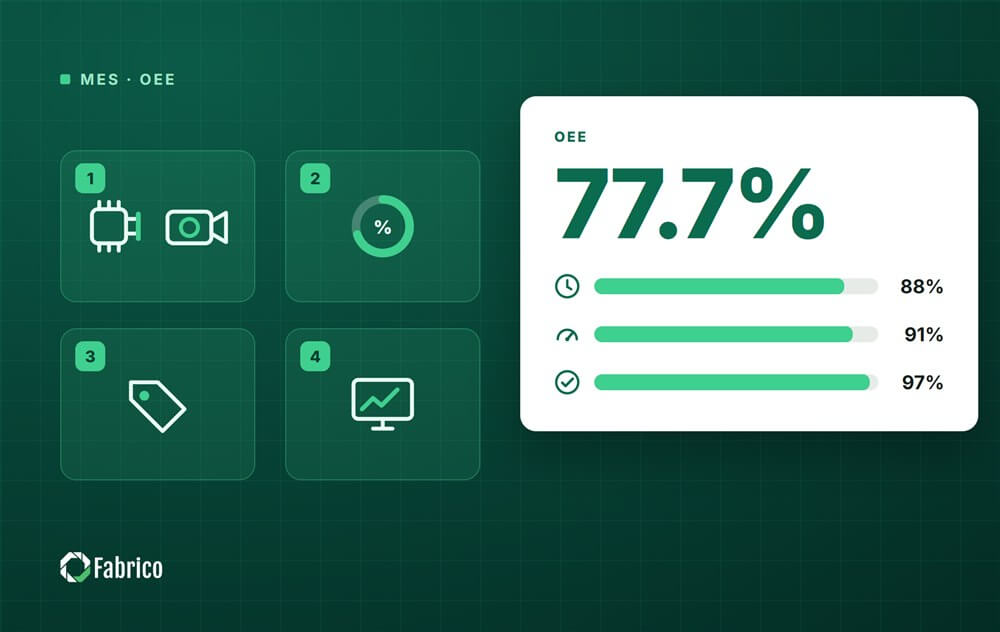
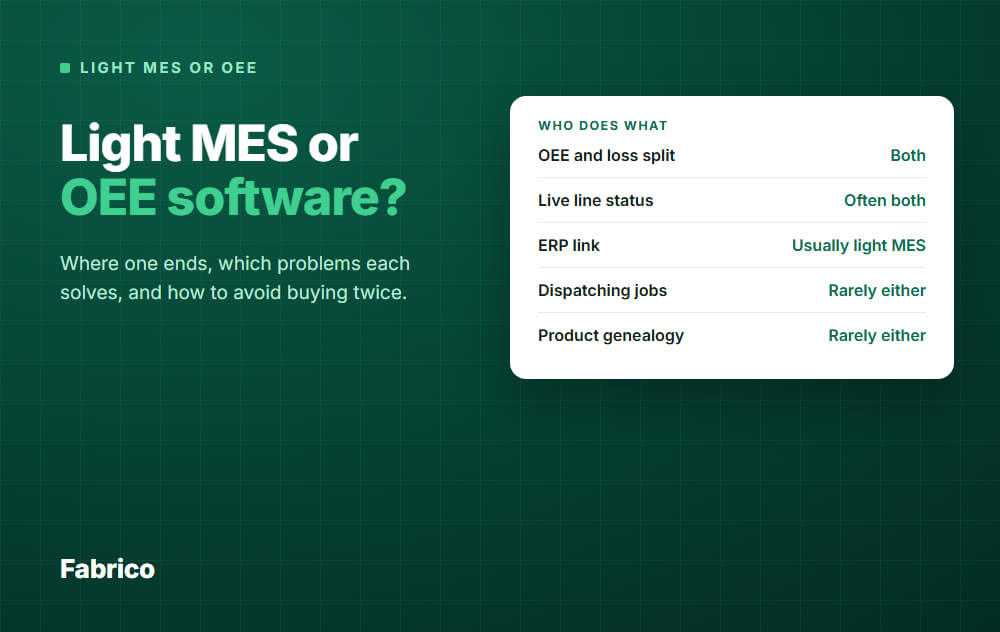
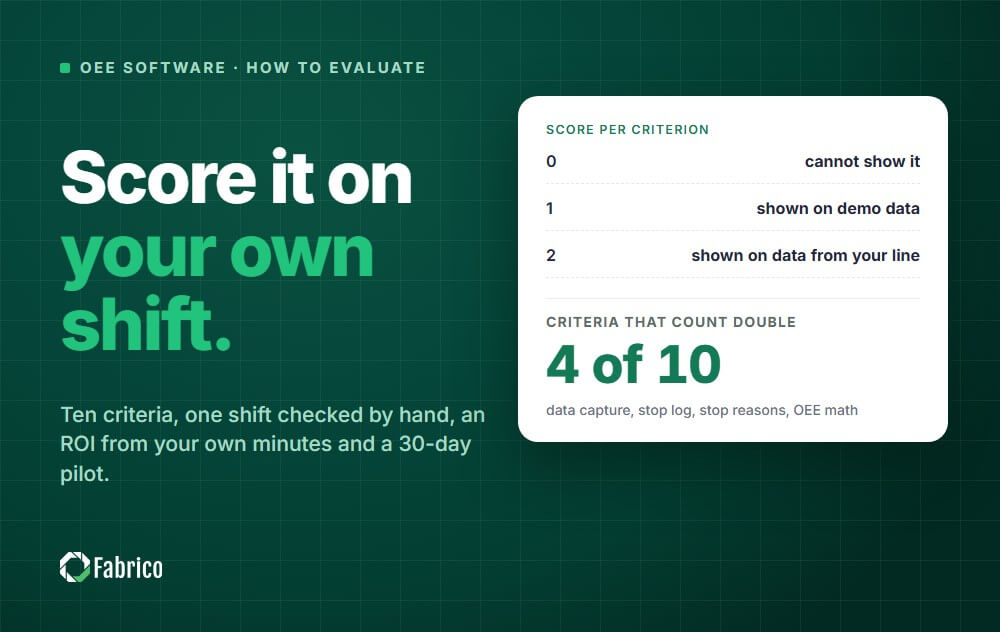







Real Fabrico tiles, sample data.