


 Login
 Blog
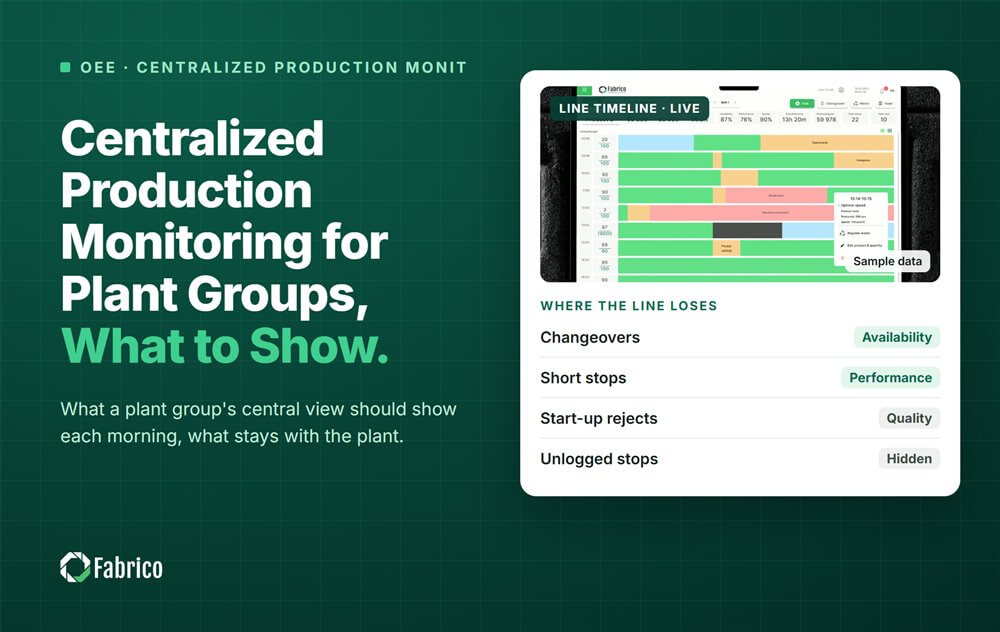
Centralized Production Monitoring for Plant Groups: What to Show

Key takeaways
- A central production view shows a plant group its lines live, on shared definitions, so head office and plants read the same numbers.
- Each morning it should show OEE (overall equipment effectiveness) by line and shift, the top losses ranked by money, and lines off their own baseline.
- Running the shift stays at the plant: reasons, fixes, the line meeting and local targets.
- It sits at ISA-95 Level 3, fed from Level 2 machine signals, below ERP (enterprise resource planning) at Level 4.
- Compare each plant with its own baseline first, and with other plants only on shared rules.
Centralized production monitoring gives a plant group one live view of every line, built on the same definitions at each site. Each morning it should show OEE by line and shift, the losses ranked by money, and which plant needs help today. Running the line stays with the plant.
Start of the day, group operations call. Three plants bring three spreadsheets and three meanings of downtime. By the time the numbers agree, the morning is gone and the fryer at one plant has stopped twice more.
This guide is for COOs (chief operating officers), group OpEx (operational excellence) leads and plant managers in multi-plant FMCG (fast-moving consumer goods) groups. It covers what the view shows, what stays local, the morning call, ISA-95 and vendor questions. It comes from Fabrico, a platform for OEE and light MES (manufacturing execution system) with computer vision on stops.
What should a central production view show each morning?
Four things, for yesterday and the shift now running. Anything more belongs in a weekly or monthly review.
- OEE by line and shift, with availability, performance and quality next to it.
- The top losses in money, across plants, with the line, the machine and the reason.
- Lines off their own baseline, up or down, so help goes where it is needed.
- Open actions from the last call, each with an owner and a date.
Our guide to OEE monitoring covers what a single plant should see while the shift runs. The central view is the same data, one level up.
What stays at the plant?
Running the shift stays at the plant. The center watches, compares and sends help; it does not run the line from a distance.
- Confirming stop reasons and fixing the stop.
- The daily line meeting and its actions.
- Local targets, set against each line's own baseline.
- Changes to machine settings and crews.
- Machine condition data such as vibration and temperature, a separate stream from production data.
For that last stream, our review of condition monitoring software covers the tools. A central production view should not try to replace them.
Why must every plant use the same definitions?
Because the view compares plants: with different rules for planned time, rated speed, short stops and good count, it ranks rulebooks, not lines. Our guides to the OEE report for head office and to rolling up OEE across sites list the rules to fix first.
How should the morning call on the central view run?
Short, in the same order each day, and straight from the central view rather than slides. A quarter of an hour covers three or four plants.
- Open on the money. The chair reads yesterday's top losses across plants, costliest first.
- Plants speak in that order. Each covers its loss, the cause it has confirmed and what it needs.
- Each item leaves with an owner and a date before the next plant speaks.
- Plants on or above baseline only confirm. One line on what went right is enough.
- Close on open actions from earlier calls: closed, or moved with a reason.
The call is about lines and losses. Nobody is named for a bad number; the people on the call speak for their lines.
Where does central monitoring sit in ISA-95?
At Level 3, manufacturing operations, fed from Level 2 machine signals and kept apart from ERP at Level 4.
ISA-95, also published as IEC 62264, gives each level its own clock. Level 2 control answers in under a second. Level 3 works in days, shifts, hours, minutes and seconds, and Level 4 in months, weeks and days.
- Level 2: PLCs (programmable logic controllers) and machine signals: running, stopped, counts.
- Level 3: OEE, downtime, reasons and losses by shift. The central view lives here.
- Level 4: ERP, with orders, cost and the monthly books. It gets summaries, not raw signals.
Having MES software is common; running it across the whole group is not. One industry report of 1,560 manufacturing decision makers in 17 countries found 93% have an MES, but only 28% run it enterprise-wide. Our page on ISA-95 levels explains the model.
What should you ask vendors of central monitoring?
Ask how the data gets in, whether the definitions hold at each site, and whether a loss shows in money. Names matter less than these answers.
- Are stops logged from the machine signal, or typed in later?
- Can each site keep the group definitions, with changes made in one place?
- Does each loss show in money, with the pricing rule visible?
- Can machines with no PLC access be connected?
- How long until the first line at each plant is live?
- Who at the plant uses it each shift, and how many taps does a reason take?
Our comparison of production monitoring systems sets the options side by side by data source.
A worked example: a group's morning view across three plants
Sample line (illustrative numbers, not a customer): a snack group with one main line in each of three plants. The table is yesterday's central view, with lost hours counted on each line's bottleneck.
| Plant and line | OEE yesterday, own baseline | Top loss | Hours lost | Margin per hour |
|---|---|---|---|---|
| Plant A, crisps line | 58%, baseline 64% | Bagger film splice stops, night shift | 3.0 | $2,500 |
| Plant B, crisps line | 71%, baseline 69% | Seasoning drum changeover overrun | 1.0 | $2,500 |
| Plant C, tortilla chips line | 49%, baseline 62% | Fryer outfeed jams, day shift | 4.5 | $2,000 |
- Plant A: 3.0 x $2,500 = $7,500.
- Plant B: 1.0 x $2,500 = $2,500.
- Plant C: 4.5 x $2,000 = $9,000.
- Gap to own baseline: Plant C 62 minus 49 = 13 points, Plant A 64 minus 58 = 6 points, Plant B 2 points above.
- Top losses yesterday = $9,000 + $7,500 + $2,500 = $19,000, or €19,000 in a euro plant.
- Ranked by money, the call takes Plant C first, then Plant A, then Plant B.
The call spends its first minutes on Plant C's fryer outfeed and sends the group's fryer expert. It asks Plant A whether the film splices come from one film supplier used at other sites too. Plant B is above its baseline, so the question there is what it did right.
Mistakes plant groups make with central monitoring
- Building the central view before the definitions match.
- Showing OEE without money, so the call debates percentages.
- Ranking plants against each other before comparing each with its own baseline.
- Pulling decisions to head office that belong at the line.
- Monthly reports where a daily view is needed.
- Typing shift sheets into a group spreadsheet and calling it live.
Where Fabrico fits
Fabrico is a computer vision enabled Manufacturing Performance Platform. OEE and light MES come first. It works in the ISA-95 Level 2 to Level 3 space; it is not an ERP and does not replace Level 4.
- One view across plants, on the same definitions at each site.
- OEE live by line and shift, from the machine signal, for yesterday and the shift now running.
- Losses ranked by money, so the morning call starts with the loss that costs most.
- Automatic downtime logging, so nobody retypes shift sheets for head office.
- The operator confirms the reason in one tap, so the reason in the central view comes from the line.
You start on one line, with a baseline and a decision date agreed in advance. There is no free plan and there are no tiers: each plant gets a quote. Read what a light MES covers to see where central monitoring fits in it.
Frequently asked questions
What is centralized production monitoring?
It is one live view of production across a group's plants and lines, built on the same definitions at each site. It shows OEE by line and shift, losses in money and lines that moved off their baseline. Head office uses it to compare and help, while each plant keeps running its own shifts.
Which vendors provide centralized production monitoring platforms?
Several kinds of vendor do: OEE and light MES platforms, full MES suites with a group layer, and data platforms built on plant historians. Compare them on how data gets in, whether definitions hold across sites and whether losses show in money. A short test on one line per plant tells you more than a feature list.
Is centralized production monitoring the same as an MES?
Not quite. An MES runs the Level 3 work of a plant, which can include orders, quality records and more. Central monitoring is the group view of part of that work: OEE, downtime and losses across sites. A light MES that starts from OEE gives the plant its OEE and the group its central view, on the same data.
Who runs the morning call on the central view?
Usually the group operations lead, or a deputy of the COO, chairs it. Each plant manager, or the shift lead who knows the night, speaks for the plant. A CI (continuous improvement) lead keeps the action list. Finance can join once a week to see the losses in money, rather than every day.
How long does it take to connect plants to a central view?
It depends on the machines and the number of lines. With Fabrico, devices are connected in about one month, and the full rollout takes 3 to 4 months. Most groups start with one line at one plant, agree the definitions there, then add lines and plants on the same rules.
See your plants in one view in a demo
Bring a list of your plants and their main lines. We will show what a morning view across them looks like, with each loss in money.
Latest from our blog


Real Fabrico tiles, sample data.