


 Login
 Blog
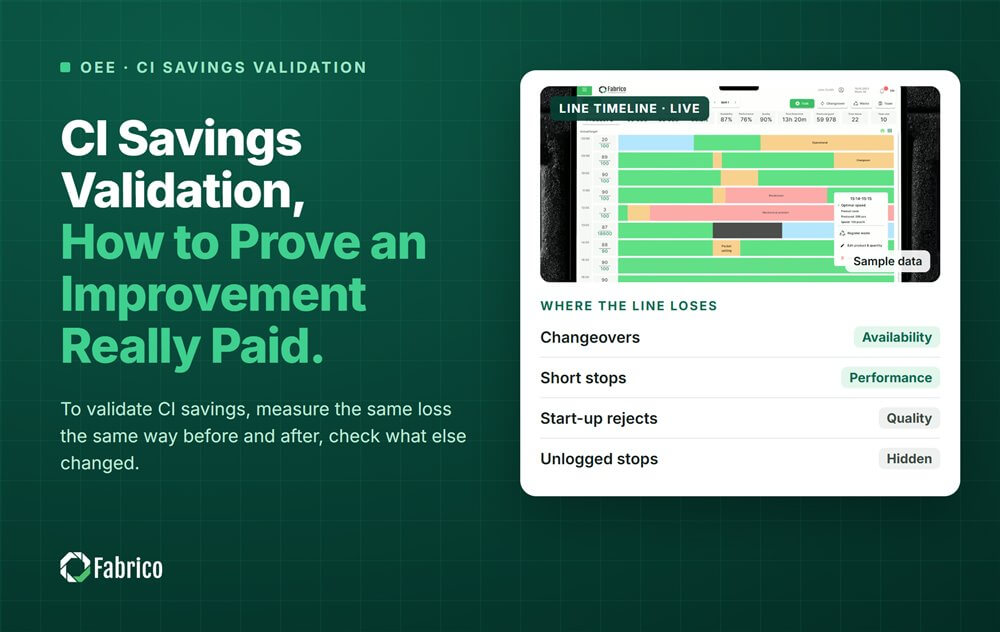
CI Savings Validation: How to Prove an Improvement Really Paid

Key takeaways
- Measure the same loss, the same way, before and after the project.
- Use at least four weeks each side, from machine data.
- Check what else changed: product mix, volume, crew, season, definitions.
- Count money only where output went up or cost went down.
- Let finance agree the method before the project starts, not after.
In the sample below, the average changeover fell 14 minutes, but only 12 survive the checks, and only one money route counts.
Fabrico is OEE and light MES software with AI cameras that logs stops automatically, so the before and after come from the same machine data. This guide is for CI leads who want their savings to survive the review with finance.
Why do CI savings get challenged?
Finance looks for the saving in the profit and loss account and often cannot find it. Usually there are three reasons:
- The definitions moved. A changeover became planned time, so OEE went up without any change on the line.
- Something else changed. A simpler product mix or lower volume made the line look better.
- Minutes were counted as money. Freed minutes are not cash unless output was sold or a cost went away.
All three can be prevented with a method agreed up front.
What should you measure before the project starts?
- The loss itself: minutes, count and reason, from the machine.
- The definitions: planned time, ideal rate, minor stop cutoff, good count. Write them down and freeze them.
- The context: product mix, volume, crews and shifts.
- The money rule: how a freed minute will be valued, and when it counts.
Our guide to OEE baseline measurement covers the first two in detail. Keep the planned and unplanned rules on one page, as our article on downtime definitions that keep OEE honest shows.
How do you rule out other causes?
- Mix. Compare the same products, or weight the result by product.
- Volume. A line with fewer orders has fewer changeovers. Compare per changeover, not per week.
- Season. Avoid a before period in the peak and an after period in a quiet month.
- Definitions. Check that the minor stop cutoff and planned time did not change.
- A control line. If a similar line had no project, see whether it improved too.
Worked example: how do you validate a changeover project?
Sample line (illustrative numbers, not a customer): a filling line, where the filler is the constraint. A team ran a changeover project. One constraint minute is worth USD 70 of throughput.
| Before (6 weeks) | After (6 weeks) | |
|---|---|---|
| Changeovers | 48 | 42 |
| Average changeover time | 52 minutes | 38 minutes |
| Same product pairs only | 51 minutes | 39 minutes |
| Changeover counted as | Unplanned loss | Unplanned loss (unchanged) |
| Control line, no project | 49 minutes | 48 minutes |
The checks hold. On the same product pairs, the time fell by 12 minutes per changeover. The definition did not change. The control line stayed flat, so this is not a seasonal effect.
Now the money. At the after rate of 7 changeovers a week, the line saves 84 constraint minutes a week.
If the plant sells the extra output, that is USD 5,880 a week. If demand is flat, 84 minutes a week will not remove a whole overtime shift. Report it as freed capacity until the plan actually drops a shift, then count that shift's cost.
Write the result on one page: the loss, the before and after, the checks you ran, and the money route. Attach the machine data for both periods. If someone asks a question in six months, the answer is on that page, not in somebody's memory.
When does a saving count as money?
When output was sold, a shift or crew was cut, or less material was bought. Freed minutes with no orders to fill them are capacity, not cash yet. Our guide to the capacity release business case covers the three routes in detail.
This is the throughput accounting view: net profit = throughput minus operating expense. A saving must move one of the two. Our guide to putting a value on OEE gains shows how to lay it out.
How do you keep the saving after the project ends?
- Write the new method as standard work, with photos, at the machine.
- Watch the same loss for three months after the project closes.
- If it creeps back, reopen the cause with an 8D instead of starting a new project.
Who should sign off a CI saving?
Two people: the operations owner of the line, and someone from finance. Both agree the method before the project starts. Then the sign off at the end is a check against the method, not a new debate. Our article on running kaizen events with proof shows how to keep the evidence.
Where does Fabrico fit?
Fabrico is a computer vision enabled Manufacturing Performance Platform. It logs stops automatically, on the definitions you agree at the pilot, and prices each loss in money. The before and after come from the same machine data, line by line and shift by shift.
The operator confirms the reason in one tap. Where a camera is fitted, a clip is kept as evidence for the stop, so finance can see what happened behind each minute.
There is no free plan and there are no tiers: each plant gets a quote.
Frequently asked questions
How do you validate continuous improvement savings?
Measure the same loss on the same definitions before and after the project, over at least four weeks each. Rule out other causes such as product mix, volume and season, ideally with a control line. Then count money only where output was sold or a cost actually went away.
Why do finance teams reject CI savings?
Usually because the saving does not show up in the accounts. The definitions may have changed, another factor such as mix may explain the gain, or freed minutes were counted as cash. Agreeing the method with finance before the project starts avoids most of these arguments.
How long should the before and after periods be?
At least four weeks each, and longer for losses that happen rarely, such as changeovers on a slow product. Avoid comparing a peak period with a quiet one. Compare per event, such as per changeover, when the number of events changes between the two periods.
Do freed minutes count as a saving?
Not by themselves. Freed minutes become money when extra output is sold, when overtime or a temporary shift is cut, or when less material is wasted. If the line has no orders to fill the minutes, report them as freed capacity, which may pay later.
What is a control line in CI validation?
A control line is a similar line where no project ran during the same period. If it improved as much as the project line, the gain probably came from something else, such as season or mix. If it stayed flat, the project is the more likely cause.
Prove your next saving on machine data
Bring one finished project and its before and after numbers. We will show what the machine data says about the same loss.
Latest from our blog


Real Fabrico tiles, sample data.