


 Login
 Blog
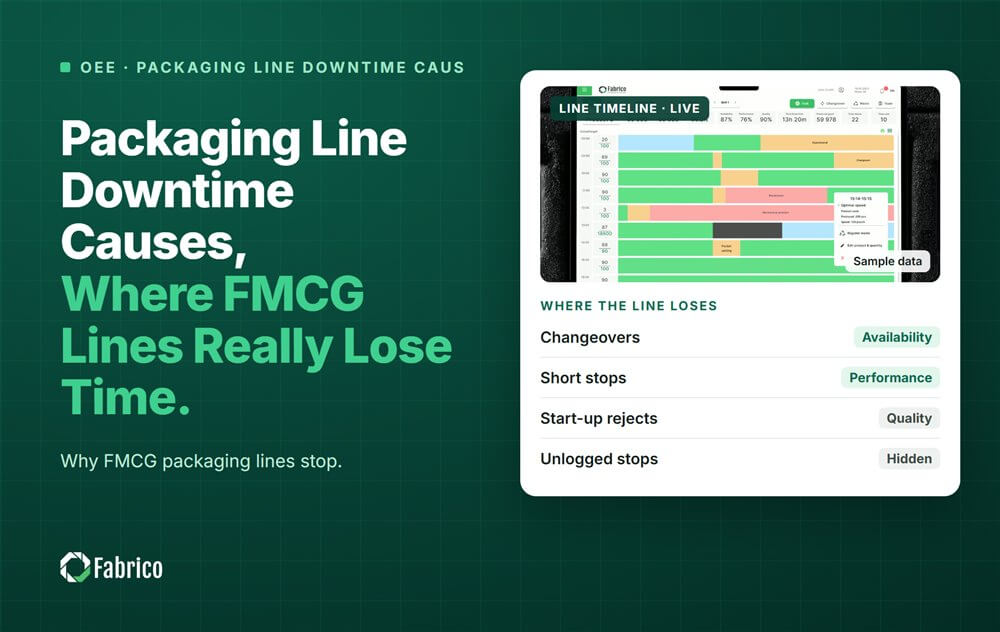
Packaging Line Downtime Causes: Where FMCG Lines Really Lose Time

Key takeaways
- Short stops are usually the biggest loss by total minutes, and the least often written down.
- Changeovers and cleaning come next on high mix lines.
- Starved and blocked time lives between machines, so a machine by machine view misses it.
- Breakdowns are what the paper log remembers, but rarely the biggest share.
- Rank causes by count, by minutes and by money before choosing what to fix.
On most FMCG packaging lines the biggest cause of downtime is not breakdowns. The minutes usually go to short stops first, then changeovers and cleaning, then starved and blocked time between machines, then slow running after restarts, and only after that to long breakdowns.
Fabrico, an OEE and light MES platform, logs each stop on each machine with its start, end and reason, which is how these smaller causes become visible. This guide lists the common causes, the machines where they show up, what the published studies found, and the first fixes that need no new equipment.
Why do packaging lines stop so often?
A packaging line is a chain of linked machines: depalletiser, filler and capper, labeller and coder, checkweigher, shrink wrapper or cartoner, case packer, palletiser. The filler is usually the slowest and costliest machine, so it sets the pace.
The usual design is the V-curve: the filler's neighbours run about 10% faster in recovery speed, the next ones another 10%, so the conveyors can empty and refill around the filler. The side effect is that only the filler runs at a steady speed. Every other machine stops and starts when nothing arrives or when its outfeed is full, and those speed changes create short stops and wear.
What are the most common causes of packaging line downtime?
| Cause | Typical signs | First fix to try |
|---|---|---|
| Short stops | Jams, fallen containers, misfeeds, sensor trips, cleared in a minute or two | Guide rails, centerlines per SKU, container handling |
| Changeover and cleaning | Format parts, settings, cleaning between SKUs, run-up to rated speed | SMED, change parts on a trolley, a standard per SKU pair |
| Starved and blocked | A healthy machine waiting for product or for space | Charge to the first machine that stopped, check buffers and recovery speeds |
| Material | Caps, labels, film or case blanks out, wrong or poor quality | Reorder points at the line, a code for supplier quality |
| Breakdowns | A fault that needs maintenance: motors, drives, pneumatics, sensors | Response time tracking, spare parts at the line |
| Slow running and start-up | The line runs below rated speed after a restart or a changeover | Start-up checklist, run-up target per SKU |
| Quality stops | Quality holds, reject stops at the checkweigher or metal detector | Separate code, measure the waiting time |
| Waiting for people | No operator at the machine, waiting for a technician or a sign off | Measure response time apart from repair time |
Short stops deserve the most attention because they hide. A fallen bottle cleared in 40 seconds does not feel like downtime, so it rarely reaches the log. Our article on micro stops on packing lines shows how they add up across a shift.
Which machines stop most on a packaging line?
- Filler and capper: bottle jams at the infeed, caps out, capper torque faults, fill level rejects.
- Labeller and coder: label web breaks, glue skips, wrong or missing date codes, roll changes.
- Shrink wrapper or cartoner: film breaks, carton misfeeds, sealing temperature.
- Case packer: blank magazine empty, blank misfeeds, glue nozzle clogs, pattern jams. See our case packer OEE guide.
- Palletiser and stretch wrapper: pallet supply, layer pattern faults, film out. When it stops long, it blocks everything upstream.
A stop on a fast machine only costs line output when it outlasts the buffer in front of the filler. That is why the cause list and the cost list are not the same list.
What do the studies say about packaging line downtime?
- A peer reviewed study of San Benedetto mineral water lines in Italy found that micro downtime under 15 minutes made up more than half of the inefficiency on the worst line.
- A craft brewer packaging benchmark by OFS found lines filling only 54% of the time, with a stop every 11 minutes 48 seconds, and an average changeover of just over 49 minutes.
- A self reported food manufacturing survey put the average changeover at just under one hour, with cleaning the most time consuming part for 59% of respondents.
- The Siemens True Cost of Downtime 2024 report found FMCG was the only sector whose downtime hours went up since 2019.
The pattern behind all of them is the same. The losses were not hidden on purpose. They sat below the logging threshold, between two machines, or inside a bucket called "planned".
How do you find your own top causes?
- Log each stop with a start and an end, from the machine signal where you can.
- Set one short stop threshold for the plant. No standard fixes it; a minute or two is typical.
- Charge starved and blocked minutes to the machine that stopped first.
- Rank by count, by minutes and by money. A cause that is frequent and short needs a different fix from one that is rare and long.
- Split the ranking by SKU and by shift, because a few formats often cause most stops.
What does a week of packaging line downtime look like?
Sample line (illustrative numbers, not a customer): a two shift beverage packaging line, one week, 1,260 lost minutes in total once each stop is logged automatically.
| Cause | Minutes | Share |
|---|---|---|
| Short stops | 430 | 34% |
| Changeover and cleaning | 310 | 25% |
| Starved and blocked | 210 | 17% |
| Material | 120 | 10% |
| Breakdowns | 110 | 9% |
| Slow running after restarts | 80 | 6% |
| Total | 1,260 |
- The paper log for the same week showed mostly the breakdowns: 110 minutes, or 9% of the real loss.
- Short stops and changeovers together are 740 minutes, almost 59% of the week.
- The 210 starved and blocked minutes are another machine's fault each time; charged correctly, most of them move to the labeller and the palletiser.
Which fixes work first, without new machines?
- Centerlines per SKU: write down the right position of every guide and setting, so a format starts right the first time.
- Guide rails and container handling: most jams and fallen containers come from a few transfer points.
- SMED on the top two changeovers: separate what must happen with the machine stopped from what can be prepared while it runs. Our guide to changeover standards on FMCG lines shows how.
- Buffers and recovery speeds: check that the conveyors around the filler can absorb the usual short stops. See starvation and blocking.
- Material at the line: a reorder point for caps, labels and film removes the "out of" stops.
- A start-up checklist for the first minutes after a restart, where speed and quality are weakest. More on that in reduced speed vs minor stops.
Where Fabrico fits
Fabrico is a computer vision enabled Manufacturing Performance Platform. OEE and light MES come first, with computer vision on stops.
- Automatic downtime logging, including the short stops a paper log misses.
- The operator confirms the reason in one tap, and a camera clip can serve as evidence for a stop where a camera watches the station.
- Every loss priced in money and ranked, so the cause that costs most comes first.
- OEE live by line and shift, and one view across plants.
You start with a pilot on one line, with a baseline and a decision date agreed in advance. There is no free plan and there are no tiers: each plant gets a quote. See how stops are captured on camera on our computer vision OEE page.
Frequently asked questions
What causes most downtime on a packaging line?
On most FMCG lines, short stops such as jams and fallen containers cause the most lost minutes, followed by changeovers and cleaning, then starved and blocked time. Long breakdowns are usually a smaller share than people expect.
What is a short stop on a packaging line?
A stop the operator clears without calling maintenance, typically in a minute or two. The plant sets the exact threshold, because no standard does.
Why does a packaging line stop more after a changeover?
Settings are new, parts may not be fully adjusted, and materials change. Without centerlines per SKU, the first hour after a changeover often has the most short stops.
How can I reduce packaging line downtime without buying machines?
Start with centerlines, guide rails, SMED on the top changeovers, reorder points for materials, and a start-up checklist. Measure before and after so you know which change worked.
Which machine is usually the bottleneck?
The filler, on most beverage and liquid lines, by design. The machines around it run faster so the line can recover after short stops.
See where your line loses time
Bring one line and its current downtime log. We will show the causes by machine and what each one cost.
Latest from our blog



Real Fabrico tiles, sample data.