


 Login
 Blog
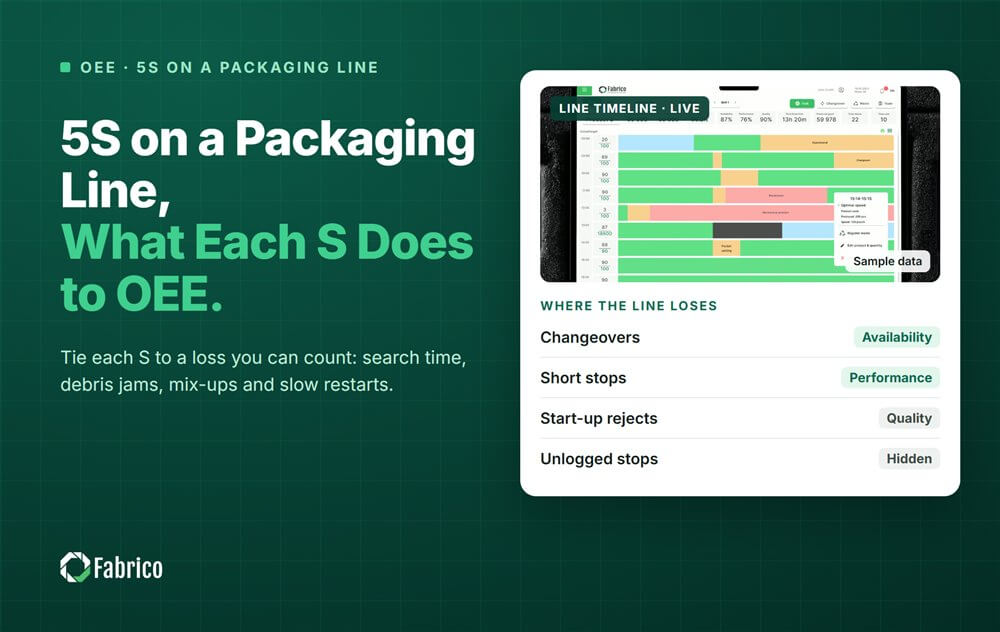
5S on a Packaging Line: What Each S Does to OEE

Key takeaways
- Judge 5S on a packaging line by the losses it removes, not by how the floor looks.
- Set in order cuts search time inside changeovers, an Availability loss.
- Shine removes film trim and dust that cause short jams, a Performance loss.
- Sort and Standardize stop mix-ups and slow restarts after cleaning.
- In the worked example, a snack bag line moves from 70.2% to 76.6% OEE (overall equipment effectiveness) with no new machines.
5S raises OEE on a packaging line when each S removes a loss you can count. Sort stops mix-ups, Set in order cuts search time in changeovers, and Shine stops debris jams. Standardize fixes slow restarts after cleaning, and Sustain keeps the gains.
This guide is from Fabrico, the OEE and light MES platform. It maps each S to an OEE loss, shows how to measure it and works one line through before and after. For the method itself, see our 5S methodology guide.
Which OEE losses does 5S remove on a packaging line?
On a packaging line, clutter and dirt turn into stops and rejects. Each S removes one kind of loss, and each loss lands in one OEE factor.
The six big losses tie it together. Search time sits in setup and adjustments. Debris jams sit in idling and minor stops. Mix-ups and restart rejects sit in process defects and reduced yield. Our guide to the six big losses shows the full map.
How does each S show up in OEE?
Sort: wrong materials at the line
Many packaging lines run several SKUs on the same machines. Leftover film or a box of old labels is a mix-up waiting to happen. The cost is a stop to swap the material, plus the packs made with it.
Set in order: search time in changeovers
Watch a changeover and count the walks. Hunting for a hex key, a change part or the right setting sheet is time the machine stands still. A shadow board at the machine and a labelled change part trolley turn searching into reaching.
Our guide to changeover time shows how to measure the full stop.
Shine: jams from loose debris
Film trim, carton dust, glue strings and crumbs collect on photo eyes, guides and suction cups. A dirty sensor sees a pack that is not there, and the machine stops for a few seconds.
Each stop is short, so it rarely reaches a paper log. Our guide to micro stops on packing lines shows how to count them.
Standardize: starts after cleaning
Cleaning moves things. Guides get loosened, a sensor gets knocked, a seal jaw cools down. Left to memory, the restart runs slow and makes rejects until someone finds what moved.
Write the clean and the restart as one routine, with marked positions on guides and rails. Keep a validated clean at full length. The gain comes from the restart, not from cleaning less.
Sustain: keep the losses from coming back
On a packaging line, the loss data is the audit. If search minutes or debris jams creep back up, the standard has slipped, whatever the floor looks like.
How do you measure 5S with OEE data?
Give each 5S loss its own reason code, so it gets its own bar on the Pareto. Our guide to downtime reason code design covers how to keep codes short.
- Add four codes in plain words: searching, wrong material, debris jam, slow restart after a clean.
- Take a baseline over a fixed run of shifts, on the SKU mix you will compare against.
- Compare the same number of shifts after, by code, in minutes and in packs.
- Price the change at contribution margin, so the result is in money, not in photos.
What does a 5S worked example on a packaging line look like?
Sample line (illustrative numbers, not a customer): a snack bag line with a bagger, a checkweigher and a case packer. The bagger is the slowest machine, rated at 100 bags a minute. Each shift has 450 minutes of planned production time.
The team tagged its losses with the four 5S codes, ran one 5S round, then measured the same number of shifts again.
| S | Loss it removes | OEE factor | Before, per shift | After, per shift |
|---|---|---|---|---|
| Sort | Wrong film or old labels at the line | Availability, Quality | 6 min stopped, 180 bags rejected | 1 min stopped, 30 bags rejected |
| Set in order | Searching inside changeovers | Availability | 14 min | 4 min |
| Shine | Jams from film trim and dust on sensors | Performance | 24 short stops, 12 min | 8 short stops, 4 min |
| Standardize | Slow restart after the mid-shift clean | Performance, Quality | 5 min slow, 200 bags rejected | 2 min slow, 60 bags rejected |
| Sustain | Keeps the gains | All three | Not tracked | Checked each shift |
Other losses stayed the same: 66 minutes of other stops, 23 minutes of other slow running and short stops, and 420 other rejects a shift.
| Item | Before 5S | After 5S |
|---|---|---|
| Stopped time | 14 + 6 + 66 = 86 min | 4 + 1 + 66 = 71 min |
| Run time | 450 minus 86 = 364 min | 450 minus 71 = 379 min |
| Availability | 364 / 450 = 80.9% | 379 / 450 = 84.2% |
| Speed loss at rated speed | 12 + 5 + 23 = 40 min | 4 + 2 + 23 = 29 min |
| Bags made | (364 minus 40) x 100 = 32,400 | (379 minus 29) x 100 = 35,000 |
| Performance | 324 / 364 = 89.0% | 350 / 379 = 92.3% |
| Rejects | 180 + 200 + 420 = 800 | 30 + 60 + 420 = 510 |
| Good bags | 31,600 | 34,490 |
| Quality | 31,600 / 32,400 = 97.5% | 34,490 / 35,000 = 98.5% |
| OEE | 80.9% x 89.0% x 97.5% = 70.2% | 84.2% x 92.3% x 98.5% = 76.6% |
- OEE check: 31,600 good bags / 100 a minute = 316 minutes of good output, and 316 / 450 = 70.2%. After: 344.9 / 450 = 76.6%.
- The gain is 2,890 good bags a shift, or 6.4 OEE points.
- At a contribution of $0.08 a bag, that is $231.20 a shift, or €231.20 in a euro plant at €0.08 a bag.
- Over 750 shifts a year: $173,400, or €173,400.
That money is real only if the extra bags sell, or if the time cancels overtime. Your controller decides that, not the software.
Set in order and Shine gave 1,800 of the 2,890 bags: 10 minutes of searching and 8 of debris jams. A paper log rarely shows either.
Which S should a packaging line start with?
Start with the S whose loss costs most on your line, not the one that looks worst. In the sample, searching cost 14 minutes a shift, so Set in order came first.
- Many changeovers: start with Set in order at the machine and the change part store.
- Long runs of one SKU: start with Shine on sensors, guides and suction cups.
- Look-alike SKUs: start with Sort and a clear line clearance check.
- A clean mid-shift: start with Standardize.
Work on the slowest machine first. A jam on a machine with spare speed and a buffer may cost no output at all.
What mistakes keep 5S from moving OEE?
- Judging 5S by the audit score and the photos, not by the loss codes.
- Shortening a validated clean to win minutes. Keep the clean and fix the restart.
- Doing 5S on the whole line at once, so nobody can tell which S moved which loss.
- Comparing before and after on a different SKU mix.
- Logging debris jams as "other", so Shine never shows up in the data.
Where Fabrico fits
Fabrico is a computer vision enabled Manufacturing Performance Platform. OEE and light MES come first: stops are logged automatically, and OEE is live by line and shift.
- Short stops counted, including the debris jams that never reach a paper log.
- The operator confirms the reason in one tap, so a debris jam at a sensor becomes its own bar.
- A camera clip as evidence for a stop, where a camera watches the machine, so the team sees what jammed.
- Losses priced in money and ranked, so the 5S round starts where it pays most.
Fabrico measures the losses. Your team runs the 5S. You start on one line, with a baseline and a decision date agreed in advance. There is no free plan and there are no tiers: each plant gets a quote. See how stops are captured on our computer vision OEE page.
Frequently asked questions
How does 5S improve OEE?
5S improves OEE by removing losses that clutter and dirt cause. Set in order cuts search time in changeovers, which lifts Availability. Shine removes debris that causes short stops, which lifts Performance. Sort and Standardize prevent mix-ups and slow restarts, which lift Quality. Measure each one with its own reason code.
Which OEE factor does 5S affect most?
It depends on the line. Lines with many changeovers often gain most in Availability, from less searching. Lines with long runs often gain most in Performance, from fewer debris jams. Tag the losses with 5S reason codes for a run of shifts, and the Pareto will show which factor moves.
How do you measure the result of 5S?
Use the loss data, not just an audit score. Give each 5S loss a reason code and take a baseline over a set number of shifts. Compare the same number of shifts after, on the same SKU mix, in minutes, packs and money.
Does 5S mean cleaning less often?
No. A validated clean, such as an allergen clean, keeps its full length. 5S makes the clean easier and the restart faster, with marked set points and a standard routine. The minutes come from the restart and from fewer debris jams, not from skipping any cleaning.
See your 5S losses in a demo
Bring one packaging line and a few recent shifts. We will show its losses by cause, priced in money, and which S to start with.
Latest from our blog



Real Fabrico tiles, sample data.