


 Login
 Blog
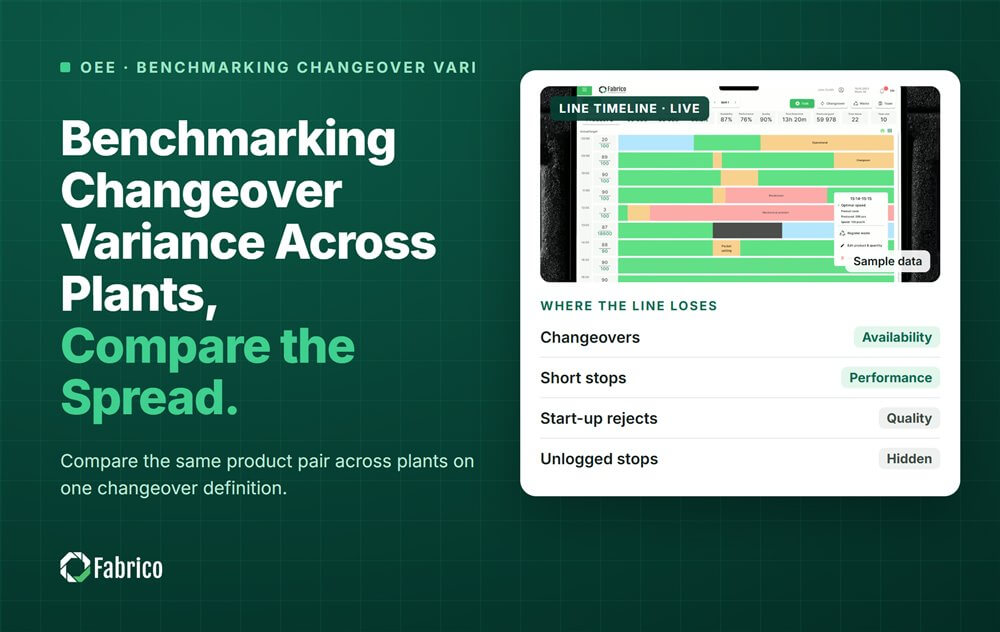
Benchmarking Changeover Variance Across Plants: Compare the Spread

Key takeaways
- To benchmark changeover variance across plants, time the same product pair on one definition everywhere and compare the spread, not only the average.
- One definition: from the last good unit of the old product to the first good unit of the new one at rated speed.
- The spread shows how repeatable the method is. A wide spread forces planners to pad each changeover.
- Copy the method of the plant with the tightest spread, then apply SMED (single-minute exchange of die) to it.
- Measure the process, never the person: compare plants and shifts, not names.
To benchmark changeover variance across plants, time the same product pair at each site on one definition. The clock runs from the last good unit of the old product to the first good unit of the new one at rated speed. Then compare the spread, not only the average. The tightest spread shows the method to copy.
Three home care plants run the same lemon to lavender change on their hand soap fillers. One plant lands close to its standard each time. Another swings from very quick to very slow depending on the night, yet both report about the same average.
This guide is for group OpEx (operational excellence) and CI (continuous improvement) leads, and plant managers in FMCG (fast-moving consumer goods) groups. It covers the definition, the spread, comparing pairs and copying the best method. It comes from Fabrico, a platform for OEE (overall equipment effectiveness) and light MES (manufacturing execution system) with computer vision on stops.
What counts as a changeover when you compare plants?
Use one definition at every site. The clock starts at the last good unit of the old product. It ends at the first good unit of the new one at rated speed. Anything else compares clocks, not changeovers.
- Inside the clock: cleaning or rinsing, format parts, settings, start-up rejects and the climb back to rated speed.
- Coded apart: waiting for material, people or a quality release inside the clock, so method and waiting can be compared separately.
- The same pair: lemon to lavender is not lavender to lemon if one direction needs a longer rinse.
- Validated cleans stay validated: never shorten an allergen clean or a CIP (clean in place) step to win a benchmark.
Some groups keep the whole changeover inside planned time; pick one rule, write it down, and use it in every plant.
Why compare the spread and not only the average?
The average hides how repeatable a changeover is. A plant with a wide spread depends on who is on shift and what goes wrong, so the plan has to pad each change.
- Average: the total of the changeover times divided by their number.
- Spread (the range): the slowest time minus the fastest. One odd change can widen it, so read it next to the slow one in ten.
- Slow one in ten: sort ten changeovers from fast to slow and take the ninth. Planners protect the plan at about this time.
Two plants with the same average can need very different plans. The one with the tight spread can promise its changeover time; the other can only hope for it.
Our guide to changeover standards on FMCG lines shows how to set the standard time per pair.
How do you compare the same product pair across plants?
Pick pairs that every plant runs, collect their changeovers over the same months, and lay the times side by side. Then look for the plant whose times cluster tightest.
- Choose two or three product pairs that each plant runs often.
- Collect each changeover of those pairs over the same months, from the machine signal, not from the shift sheet.
- Check the definition: same start, same end, same rated speed for the new product.
- Work out the average, the spread and the slow one in ten per plant.
- Split by shift too. A wide spread on nights only points to support at night, not to the crew.
- Mark the plant with the tightest spread at a fair average. That method is the one to study.
Published OEE benchmarks by industry say nothing about your lemon to lavender change. Our page on what a good OEE score is explains why a single score misleads.
How do you copy the method of the tightest plant?
Go and watch it, write it down, and test it at the other sites on the same pair. The tight plant's crews usually do the same steps in the same order with the same kit.
- Send the people who run the change at the other plants to watch two changes at the tight plant.
- Write the sequence, the kit list and the settings as one standard for the group.
- Run the next ten changes at each site on the new standard, then compare the spread again.
Then cut the time itself. SMED, from Shigeo Shingo (1985), splits internal steps, done with the machine stopped, from external steps done while it runs. Our guide on how to reduce changeover time and the SMED method page cover those steps.
What do you need to run the benchmark?
Machine-timed changeovers on one definition, tagged with the product pair, from each plant. A spreadsheet can hold one month of it; keeping it honest across sites for a year is harder.
- Start and end of each changeover from the machine signal, on one clock.
- The old and new product codes, so pairs can be matched.
- A reason for each overrun minute, confirmed by the operator.
- One view across plants, so nobody rebuilds the comparison by hand each month.
A worked example: one hand soap changeover in three plants
Sample line (illustrative numbers, not a customer): three plants run the same filler change, lemon to lavender hand soap in 250 ml pump bottles. A rinse between fragrances is part of it. Each plant logged ten of these changes in the quarter, timed to the first good bottle at rated speed.
| Plant | Ten changeovers, minutes, fast to slow | Average | Spread | Slow one in ten |
|---|---|---|---|---|
| North | 38, 39, 40, 41, 42, 42, 43, 44, 46, 49 | 42.4 | 11 | 46 |
| South | 26, 28, 30, 32, 35, 38, 44, 55, 68, 78 | 43.4 | 52 | 68 |
| East | 44, 46, 47, 48, 49, 50, 51, 52, 55, 62 | 50.4 | 18 | 55 |
- Averages: North 424 / 10 = 42.4 minutes, South 434 / 10 = 43.4, East 504 / 10 = 50.4.
- On averages alone, North and South look the same.
- Spread: North 49 minus 38 = 11 minutes, South 78 minus 26 = 52, East 62 minus 44 = 18.
- Slow one in ten, the ninth time when sorted: North 46, South 68, East 55.
- Planners protect the plan at that time, so South books 68 minutes a change and North 46.
- South runs this pair 24 times a month: 24 x (68 minus 46) = 528 minutes a month more than North's method would book.
- That is 528 / 60 = 8.8 filler hours a month South cannot promise.
- At $1,500 contribution per filler hour, that is 8.8 x $1,500 = $13,200 a month if the hours could be sold.
- In a euro plant at €1,500 an hour, it is €13,200.
North has the method to copy: a tight spread at a good average. South's two fastest changes, at 26 and 28 minutes, are worth studying, but they are not a method until they repeat. East is steady but slow, so it needs SMED more than a new sequence.
Mistakes plants make when benchmarking changeovers
- Each plant starts and stops the clock at a different point.
- Averages only, so a plant that swings wildly looks as good as a steady one.
- Changeovers booked as planned time, so the overrun minutes vanish.
- Names next to the slow times. Compare plants and shifts, never people.
- A validated clean shortened to look good in the benchmark.
Where Fabrico fits
Fabrico is a computer vision enabled Manufacturing Performance Platform. OEE and light MES come first, and changeovers are one of the losses it times from the machine at each plant.
- Automatic downtime logging, so each changeover starts and ends on the machine signal, the same way at each site.
- The operator confirms the reason in one tap, so overrun minutes carry a cause.
- One view across plants, so the same pair can be compared without a spreadsheet.
- Losses ranked by money, so the changeovers that cost the group most come first.
You start on one line, with a baseline and a decision date agreed in advance. There is no free plan and there are no tiers: each plant gets a quote. Book a demo to compare changeovers across your plants.
Frequently asked questions
What is the best tool to benchmark plants on changeover variance?
Any tool that times changeovers from the machine signal on one definition, tags each with its product pair and shows all plants in one view. A spreadsheet can work for one pair and one month. Across several plants and a full year, an OEE platform with one view across plants keeps the data honest with far less effort.
How many changeovers do you need before comparing plants?
Enough to see the spread. Ten or more of the same pair at each plant is a fair start; with fewer, one odd change can decide the result. Collect them over the same months, so seasons, staffing and material batches hit every plant alike, and keep adding as the standard changes.
Why does changeover variance matter more than the average?
Because the plan has to protect the slow changes, not the average ones. A plant with a wide spread books extra minutes on each change to stay safe, and that time is lost capacity. A tight spread means the method repeats, so the plant can promise its changeover time and plan shorter runs.
Should changeover time count as planned or unplanned downtime?
Most plants set a standard time per product pair. The standard portion is planned, and each minute over it is unplanned with a reason code. That keeps OEE honest and still shows the overruns. Our guide to planned and unplanned downtime definitions explains the rule.
Compare your plants' changeovers in a demo
Bring one product pair that several plants run. We will show how its changeover times line up when each site uses the same clock.
Latest from our blog





Real Fabrico tiles, sample data.