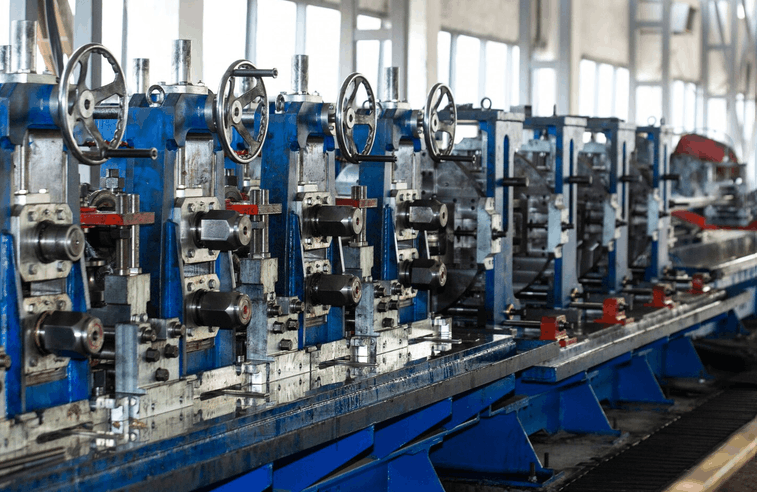
Capacity utilization is the percentage of a plant's maximum possible output that it actually produces over a given period. It compares real output against full theoretical capacity, revealing how much of your installed equipment, labor, and time is genuinely being used to make sellable product versus sitting idle.
The core calculation is simple and works at the machine, line, or plant level. Express both figures in the same unit (units, hours, or tonnes) and over the same window.
Maximum possible output is what you could produce if the asset ran at its designed rate for all available scheduled time. Actual output is what you truly shipped or completed. The gap between the two is your unused capacity, and it is where hidden cost and lost margin live.
Numbers make the metric concrete. Imagine a packaging line rated to fill 1,200 units per hour, scheduled for two 8-hour shifts across 20 working days in a month.
A 70% result means 30% of the line's designed capacity produced nothing. If each unit carries even a small contribution margin, that idle third represents a large recoverable number every month, before you buy a single new machine.
There is no universal target, but manufacturing benchmarks cluster in recognizable bands. Interpret your number against your own scheduling model rather than a headline figure.
Context matters. A make-to-order shop may run a lower rate deliberately, while a capital-heavy continuous process aims high because idle time is so expensive.
These two metrics answer different questions and should be read together, not confused. Capacity utilization asks how much of your total available capacity you used. Overall Equipment Effectiveness (OEE) asks how well the time you did run was spent, combining availability, performance, and quality.
Used side by side, they separate two problems: a demand or scheduling gap (low utilization) versus a losses-during-runtime gap (low OEE). Fabrico's real-time OEE monitoring gives you the runtime detail that a raw utilization number cannot.
Capacity utilization is a financial signal disguised as a production number. Fixed costs like rent, depreciation, and salaried labor are spread across whatever you produce, so higher effective utilization lowers cost per unit.
Improvement comes from closing the gap between scheduled and productive time, not from pushing assets past their limits. Work through these levers in order.
No. Running at 100% leaves no buffer for maintenance, demand spikes, or setup changes, and it accelerates wear on equipment. Most well-run plants target a sustainable band, often around 80% to 85%, that keeps assets productive while preserving headroom to absorb variation without missing orders or burning out machines and crews.
Capacity utilization measures how much of your available capacity you used, while efficiency measures how well you used the time you were running. You can have high utilization with poor efficiency if a machine runs constantly but slowly or with defects. Reading both together, alongside OEE, gives a complete picture of production performance.
Track it continuously at the machine level and review it weekly and monthly for trends. Real-time production monitoring lets you spot a falling rate the same shift it happens, rather than discovering the gap in a month-end report. Frequent measurement turns capacity utilization from a backward-looking accounting figure into an operational decision tool.
Ready to see your true capacity utilization in real time? Book a Fabrico demo to see how real-time OEE monitoring and CMMS work together to close the gap between scheduled and productive hours across your plant.
See how Fabrico unifies OEE and maintenance in one platform.
Request a demo











 Login
Login
 Blog
Blog