







 Login
 Blog
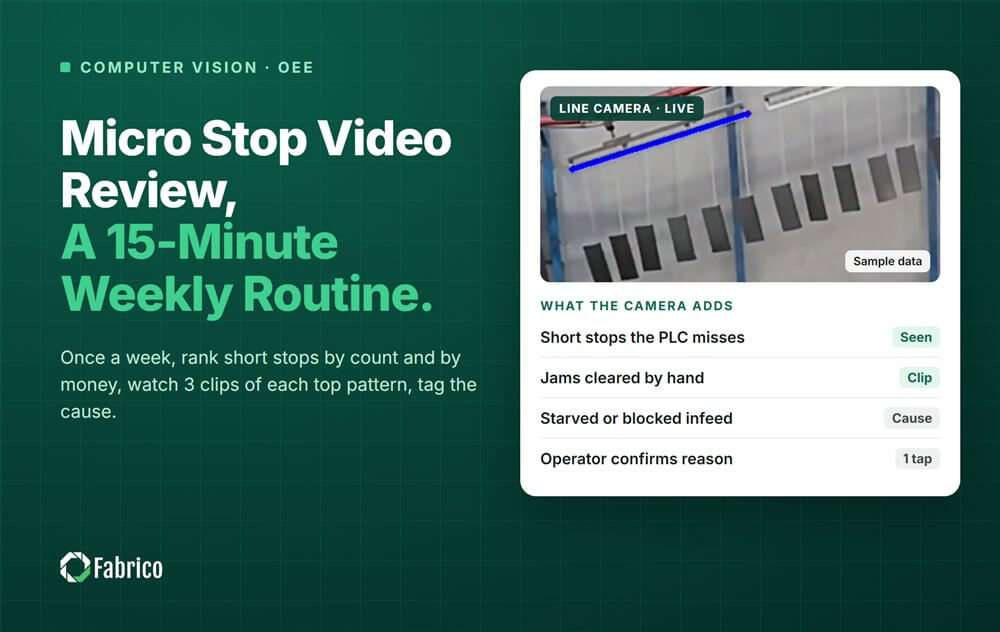
Micro Stop Video Review: A 15-Minute Weekly Routine

Key takeaways
- Block 15 minutes a week for one line, with the same steps every time.
- Sort short stops by count and by money. The two lists rarely agree.
- Watch 3 clips per top pattern, tag the cause and pick one fix.
- On the sample line, the most frequent stop was not the costliest: cap chute jams cost $1,800 a week.
To review micro stops on video, take one line's short stops from the past week and rank them by count and by money. Watch three short clips of each top pattern, tag what you see, choose one fix, and check the same numbers a week later.
Fabrico, OEE and light MES software with AI cameras, logs each stop from the machine signal. Where a camera watches the station, the stop gets a short clip, and the operator confirms the reason in one tap.
Below is the weekly routine a CI lead can run on that data. For the basics, read our guide to micro stops and computer vision.
What is a micro stop video review?
A micro stop video review is a short weekly check of a line's short stops: rank them, watch clips of the worst, pick one fix. It turns a long list of small events into one decision.
A micro stop is a short halt the operator clears alone, typically a minute or two. A stop code says "jam". A 20 second clip shows where the jam started.
How does the 15 minute review run, minute by minute?
Same day, same time, same line. A fixed slot keeps the review alive in a busy week.
| Minutes | Step | What you leave with |
|---|---|---|
| 0 to 2 | Check last week's fix | Count and minutes for that pattern, before and after |
| 2 to 5 | Sort by count and by money | The top patterns on both lists |
| 5 to 11 | Watch 3 clips per pattern | One line of notes per clip |
| 11 to 13 | Tag the cause | A cause per pattern, or a new reason code |
| 13 to 15 | Pick one fix | One change, one owner, one date |
The check comes first on purpose: this week's fix is next week's first two minutes. To run it, you need stops logged automatically, down to the short ones. You also need clips of 10 to 30 seconds at the stations that stop most, and a short reason list in the operators' words. Our guide to operator friendly reason codes helps.
Why sort short stops by count and by money?
Count tells you what the crew feels. A stop that happens many times a shift is the one everybody complains about. Money tells you what the line loses. A rarer, longer stop at a station that holds up the line can cost more.
So sort twice. Price each pattern at its minutes times the value of a lost minute. Take the top two by money, plus the top one by count if it is not already there.
Keep the money honest: a lost minute is worth full output only when the line is sold out, or the lost units cost overtime. Agree that rule with your controller.
Which clips should you watch, and what do you look for?
Not all of them: our guide to OEE dashboards with video context shows why watching everything fails. Three clips per pattern show whether the stops look alike.
Pick them by a fixed rule: one from early in the week, one from late, one from another shift. Then ask each clip the same four questions:
- What happens in the seconds before the stop?
- Where does it start: the product, a guide, the material or the machine?
- What did the clear need: a hand, a tool, a reset or a new roll?
- Does the scene match the reason the operator tapped?
Write one line per clip. Name the station and the scene, never the person.
What does each micro stop pattern look like on the clip?
Most short stops on a packaging line fall into a few patterns, and the clip points to the first place to look.
| Pattern | What the clip often shows | Look first at |
|---|---|---|
| Fallen bottles at the infeed | Bottles wobble at a guide gap, then fall | Guide settings for that format |
| Label applicator jam | The label web folds near a roll splice | Roll splices |
| Cap chute jam | Caps stack crooked after a hopper refill | Hopper fill level |
| Case blank misfeed | Two blanks picked at once, or a warped blank | Blank storage |
| Product pile up | Product backs up, the machine waits | The machine downstream |
| Untagged stops | Often a pattern nobody has named yet | A new reason code |
A pile up usually means a blocked machine, so charge it to the machine that stopped first. And a clip shows a scene, not a proven cause: your fix tests it.
What does one week of review look like on a sample line?
Sample line (illustrative numbers, not a customer): a bottling line where the filler sets the pace at 300 bottles a minute. Cameras watch the capper and the labeller. The line runs 10 shifts a week, and short stops are stops under 2 minutes.
The buffers here are short, so each stop minute at these stations is a lost filler minute: 300 bottles. At a contribution of $0.10 a bottle (or €0.10 in a euro plant), one lost minute is worth $30.
| Pattern | Stops | Average | Minutes | Money |
|---|---|---|---|---|
| Fallen bottle at the labeller infeed | 140 | 15 s | 35 | $1,050 |
| Label applicator jam | 45 | 60 s | 45 | $1,350 |
| Cap chute jam | 40 | 90 s | 60 | $1,800 |
| Untagged | 24 | 30 s | 12 | $360 |
| Total | 249 | 152 | $4,560 |
- By count, fallen bottles lead with 140 stops.
- By money, cap chute jams lead: 40 x 90 seconds = 60 minutes, and 60 x $30 = $1,800 a week.
- So the review watches 9 clips: the top two by money, and the top one by count.
What the clips showed:
- Cap chute: in all 3 clips, caps stack crooked within a minute of the hopper being filled to the top.
- Label jam: in 2 of 3 clips, the label web folds at a roll splice.
- Fallen bottles: all 3 clips show bottles tipping at the same guide gap, on the 500 ml format.
One fix this week, the cheapest change on the costliest pattern: a maximum fill mark on the cap hopper. Owner: the line lead. Date: the next review.
Next week, minutes 0 to 2: cap chute jams fell from 40 to 12, still about 90 seconds each. That is 18 minutes, or $540. The line got back 42 minutes, or 12,600 bottles, worth $1,260 a week. Over 50 weeks that is $63,000 a year (or €63,000), if the line is sold out.
How do you pick one fix and check that it worked?
- Pick the cheapest change on the costliest pattern: a setting, a mark, a guide.
- Name an owner who can change the condition, not the crew that cleared the stop.
- Check the count and the average length. A fix can cut the count but make each stop longer.
- Watch for a stop that moved to the next station.
Keep a fix for two weeks, then write it into the standard for that format. To fix short stops in batches across a line, see our article on micro stops on packing lines.
How do you keep video reviews fair to the crew?
Point the cameras at the process: the chute, the guide rail, the label web. Report by line and shift, never by named operator, and keep clips out of personal reviews. A clip of a warped blank defends the operator.
In Germany and France, agree the camera use with the works council or CSE first. Our guide to line cameras without surveillance covers the design.
Where Fabrico fits
Fabrico is a computer vision enabled Manufacturing Performance Platform. OEE and light MES come first; the cameras are an add-on that give a stop its evidence.
- Automatic downtime logging, down to short stops.
- AI cameras count output and record stops, and each vision event gets a short clip.
- The operator confirms the reason in one tap.
- Losses ranked by money, so the sort in minute 2 is already done.
- OEE live by line and shift, and one view across plants.
Named results: ABB, 20% less downtime, and Ficosota (see the Ficosota story). You start on one line, with devices connected in about a month, and the full rollout takes 3 to 4 months. There is no free plan and there are no tiers: each plant gets a quote. See the computer vision OEE and MES page.
Frequently asked questions
How many clips should I watch per pattern?
Three is a good start. One clip can mislead, and ten take too long. Pick them by a fixed rule, such as early week, late week and another shift. If all three look the same, you have a pattern. If not, one code may hide two problems.
Should I rank micro stops by count or by minutes?
Use both, then price them. Count shows how often the crew is interrupted. Minutes times the value of a lost minute shows what the line loses. When the lists disagree, fix the costliest pattern first and keep the most frequent one for next week.
What if the clip does not show the cause?
Then the camera cannot answer that question, and that is worth knowing. Watch the station live, or check the machine data. If a pattern keeps starting out of frame, the camera may need to move, or the station may need a second view.
Does the camera decide the cause of a micro stop?
No. The camera records the stop and its clip, and the screen can suggest a reason. The operator confirms it in one tap. In the review, the team reads the clips and agrees which cause to test. The clip is evidence, not a verdict.
See your line's short stops in a demo
Bring one line and last week's downtime list. We will sort its short stops by count and by money and show the clips behind the top patterns.
Latest from our blog


Real Fabrico tiles, sample data.