Login
 Blog
OEE Dashboard With Video Context: What It Adds and What to Check

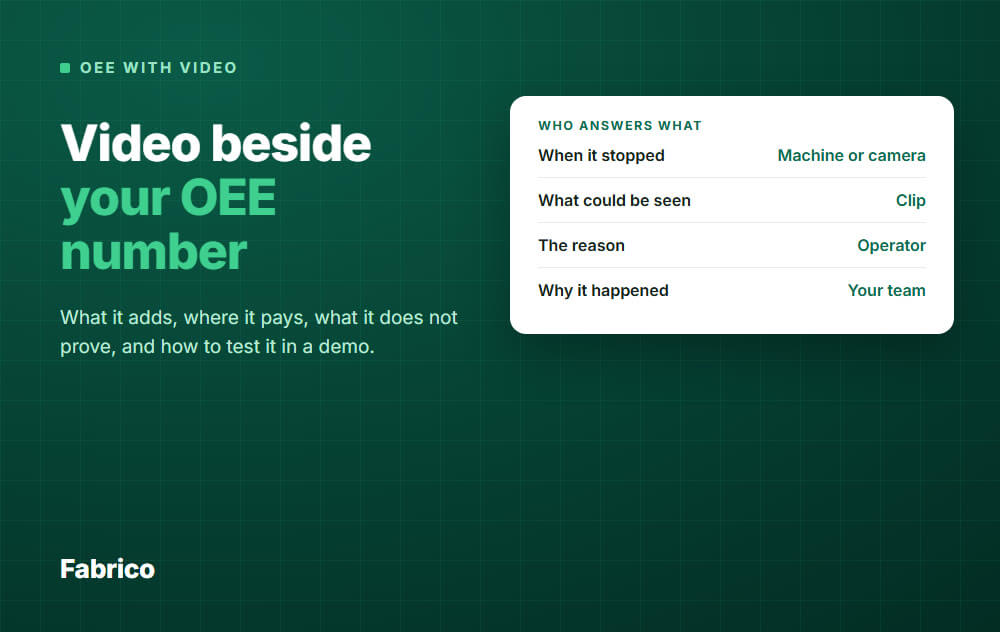
In short: Video beside an OEE number shows what could be seen when a line stopped. It helps most on stops people argue about, and it does not tell you why the stop happened.
- The machine or camera signal gives the time. The clip gives the scene. The operator confirms the reason. Your team finds out why.
- It pays on disputed stops, unknown stops and stations with no machine signal.
- It pays little on faults hidden inside a machine, or if nobody has time to watch.
- Settle camera framing, access and clip retention with your works council before you install.
- In a demo, test the path from the number to the clip with your own kind of stop.
An OEE dashboard tells you the line lost 90 minutes on Tuesday. It does not show you what those 90 minutes looked like.
That is the gap video is meant to fill. This guide helps a plant manager decide if it is worth having, and how to test it.
One note: we sell this software, including the camera option. So we also say where video adds little.
What video context means on an OEE dashboard
Video context means a clip tied to a point on the OEE timeline. You click a stop and see that moment, without searching through hours of footage.
CCTV shows a place. Video context shows a loss.
Three things must line up for it to work:
- A stop or slow period, from a machine, sensor or camera signal.
- A clip from the same moment, on the same clock.
- A reason, tagged or confirmed by a person.
What the clip adds to the number
The OEE calculation does not change. The clip changes the conversation about the loss behind it.
- A shared picture. Production and maintenance look at the same scene, instead of two memories.
- Help for the reason code. An operator back from a busy hour can see the stop and tag it with more care.
- A clue to the sequence. You can see what happened just before the stop, if it happened in frame.
- Stops nobody writes down. A 40 second stop rarely reaches the clipboard, and in OEE it usually hides in the performance loss. A clip lets you review it later.
Where it pays, and where it does not
Do not buy video for the whole plant by default. Check where your losses sit first.
| Your situation | Value of video | Why |
|---|---|---|
| Shifts disagree on what causes the same stop | High | Both sides see the same scene |
| Large share of stops tagged "other" or left unknown | High | The clip helps people tag the stop |
| Short, repeated jams at a visible point | High | The pattern shows up across clips |
| Line looks "on" but no product moves | High | A run signal can miss it, a view of the line can show it |
| Manual stations with no machine signal | High | The camera may be your only signal there |
| Faults inside a closed machine, or a view blocked by guards or steam | Low | The camera cannot see in |
| Losses driven by temperature, pressure or torque | Low | You need a sensor reading |
| Stops with a clear machine alarm and an agreed fix | Low | You already know what happened |
| No one owns the top losses | Low | More evidence will not create an owner |
You cannot watch it all: an example
Video costs attention. All numbers here are example data.
- A line has 40 stops a shift and runs 2 shifts, 5 days a week: 400 stops.
- Each clip takes 2 minutes to watch: 800 minutes, or more than 13 hours a week.
Nobody will do that.
Instead, pick the top 3 causes on your downtime list and watch 5 clips of each, across different shifts. That is 15 clips, or 30 minutes a week.
For each clip, ask two questions: does the scene fit the tagged reason, and does it look like the other clips of that reason?
If 5 of your 15 clips do not fit, you have learned something useful. Your reason list or your tagging needs work, so the ranking may be wrong too.
What a clip does not prove
A clip is evidence, not a finding, and it is easy to over-read one.
| The clip shows | It does not prove |
|---|---|
| A carton jam at the infeed | Why it jammed: a worn guide, a bad lot or the wrong speed setting |
| An empty conveyor | Who or what upstream caused the gap |
| An operator away from the station | Any fault by that person. They may have been fetching material or helping on another line |
| A machine standing still | What went wrong inside it |
| The first thing you can see going wrong | The first thing that did go wrong. That may be out of frame, or hours earlier |
Three more traps are worth knowing:
- Suggested is not confirmed. An AI model can propose a likely reason, but it is learning from past tags. If those tags were poor, its guesses can be too.
- The click can become a habit. People may accept a suggestion without looking. Check how often operators change it. If they never do, ask why.
- Picked clips can mislead. Five dramatic clips can make a small loss feel large. Use the minutes on your downtime list to rank, and the clips to understand.
So do not treat video as root cause analysis. Finding out why still takes people at the line, a test and a check that the fix held.
Privacy and works council questions
This is general information, not legal advice. Rules differ by country, so ask your data protection officer and local counsel.
Is a production clip personal data?
It can be. GDPR Article 4 covers any information about an identified or identifiable person, so a recognisable operator in frame counts.
That brings in the Article 5 principles: a stated purpose, no more data than you need, and no longer storage than you need.
Do we need an impact assessment?
Article 35 requires one before processing that is likely to bring a high risk to people. It also says to seek the views of those affected or their representatives where appropriate.
Assume you need to do this work, and let your data protection officer decide what form it takes.
Does the works council get a say?
In Germany, section 87 of the Works Constitution Act gives the council co-determination on technical devices designed to monitor employee behaviour or performance. If the two sides cannot agree, a conciliation committee decides.
Do not assume that "we only film the machine" ends the talk. Take it to the council early, with the camera positions and example frames in hand.
How long can we keep clips?
This is where the use case and the rules pull apart. A weekly review needs clips kept for at least 7 days.
Section 8 of the EDPB video guidelines says footage should in most cases be erased after a few days. The longer you keep it, "especially when beyond 72 hours", the more you must justify it.
Their examples are security cameras, so ask your data protection officer how this applies to process cameras.
Write down the period you need and why. If you cannot justify a week, run the review more often.
Can the system read people's emotions?
It should not. Article 5 of the EU AI Act bans AI that infers emotions in the workplace, apart from medical or safety reasons.
Ask any vendor to confirm this in writing.
What to agree before installing
- Framing: what each camera sees, shown with a real frame, and what it must not see.
- Purpose: clips are for process losses. Say in writing whether they may be used in any personal review or discipline.
- Access: which roles can watch and export clips, and whether that is logged.
- Retention: how long clips stay, and how they are deleted.
- Openness: operators know where the cameras are, and can see the clips of their own line.
The clip should challenge the process, never rank a person. If people fear the camera, your tagging will get worse, and the numbers with it.
Which type of system to look at
There is no single best OEE dashboard with video context for plant managers. The right type depends on what you already own.
| Type | Fits when | Watch for |
|---|---|---|
| OEE or light MES software with cameras | You want stops, clips and reasons in one place | How the camera view covers your key stations |
| Existing CCTV linked to a separate OEE tool | Cameras already view the line from a useful angle | Clock sync, and who maintains the link |
| Video time study tools | You study one job in depth, for a short time | They do not give you a running OEE number by themselves |
| Machine vision for inspection | The main problem is visible defects | Built to judge parts, so check what it records about stops |
What to check in a demo
A prepared demo always looks smooth. Bring these tests, and score each one on the call.
| Ask them to show | A good answer looks like |
|---|---|
| The path from the OEE number to a clip, live | A few clicks, from number to loss to stop to clip, with no file search |
| A short stop, not only a long one | A 30 second stop has a clip you can use |
| The time before the stop | The clip starts early enough to show what led up to it |
| The clock | A clear answer on how clips, machine data and stop times stay in sync |
| A stop with no camera in view | The dashboard says so plainly, and does not hide the gap |
| A wrong suggested reason | The operator changes it quickly, and the suggestion is clearly marked as a suggestion |
| The learning phase | What happens before the model is ready, and how you would measure it on your line |
| All clips of one reason on one line | A filter that lets you run the weekly review from the example above |
| Who watched what | Roles, access rules and a clear answer on logging |
| Retention and deletion | A stated period, who can set it, and how clips are removed |
| Camera count for your line | A view on your process, not a generic number |
Then ask what the system does not do, and score how clearly they answer.
How Fabrico fits
Fabrico is a light MES: cloud software for OEE and downtime. Machine data comes from PLCs, from IoT devices with sensors on older machines, and from cameras where there is no machine signal.
With the Fabrico camera, footage is synced with machine and timeline data, so you can zoom in on the moment of a stop.
- The footage, the machine record and the operator's reason sit in one place.
- After a learning phase, AI models suggest a likely reason from patterns on your line.
- The operator or shift lead confirms it.
- The camera can also count parts and detect cycles where there is no machine signal.
- The number of cameras per line is agreed after a review of your process and machines.
On data: Fabrico holds ISO/IEC 27001 and hosts data on AWS in the EU, encrypted in transit and at rest. Access is role-based, and a data processing agreement sets out how data is handled under GDPR.
Plan on about 1 month to install and connect devices, and 3 to 4 months for a full rollout.
What Fabrico does not do. It has no root cause analysis workflow: no cause tree and no investigation file.
It gives your team evidence to start from, and your team finds out why.
Job dispatching, BOMs, routings and genealogy stay in your ERP.
The camera page does not publish an accuracy figure or a clip retention period. Ask us in the demo, and get the answers for your lines in writing.
Request a demo or Contact us to go through the test list above.
What people ask next
Do we need video on all our lines?
Usually not at first. Start on the line with the most disputed or unknown stop time, and see if the weekly review changes any decision.
Where should the camera point?
At the process: the product flow and the key machine area, framed to avoid watching a person at a workstation. See production line cameras without surveillance.
How do we prepare for the works council meeting?
Define the purpose, map the data and run the impact assessment, then brief the council with a live demo. The works council approval guide walks through the order.
How do clips connect to our downtime reason codes?
Build the reason list first, then join camera events to the stop timeline on one clock. See connecting line cameras to downtime codes.
What else should the dashboard show?
The live score against target, the three OEE factors, ranked downtime reasons and a short trend. See these OEE dashboard examples.
Want to run these tests on your own kind of line? Request a demo or Contact us.
Latest from our blog