
Key takeaways
Short answer: FMEA and fault tree analysis attack reliability from opposite directions. FMEA starts at the bottom — every component and its failure modes — and works up to the effects, surveying broadly and ranking what matters most by risk. Fault tree analysis starts at the top — a single undesired event, like a line-down or a safety hazard — and works down through the logical combinations of causes that could trigger it. One is a wide inductive sweep; the other is a deep deductive dive. Used together they cover both breadth and depth. For where this connects to strategy, see preventive vs condition-based maintenance.
Failure Mode and Effects Analysis is a structured, bottom-up survey. You walk through each component, subsystem, or process step, list the ways it could fail (its failure modes), and trace what each failure would do downstream (its effects). Each line is then scored — commonly on severity, occurrence, and detection — and multiplied into a risk priority number that ranks where to act first. FMEA's strength is breadth: it forces a team to consider everything that could fail, not just the failures they already worry about, and to triage them consistently. Its limitation is that it generally treats failure modes one at a time, so it is weaker at capturing how several faults combine.
Fault Tree Analysis runs the other way. You begin with a single top event — the specific outcome you must prevent, such as conveyor stops unexpectedly or reactor over-pressure — and decompose it downward. Using logical AND and OR gates, you map the combinations of lower-level faults that could produce it, branching until you reach root causes. FTA's strength is depth and logic: it shows not just what can cause a failure but how causes must combine, making it ideal for critical or safety-related events where you need to understand and quantify exactly how a system reaches a bad state. Its limitation is scope — it analyses one top event at a time.
This is the heart of it. FMEA is inductive and bottom-up: from causes to effects, broad coverage, one failure mode at a time. FTA is deductive and top-down: from one effect to its combinations of causes, deep logic, including simultaneous faults. FMEA answers what could go wrong across this whole system and which risks dominate. FTA answers how exactly could this one bad thing happen, and what has to line up for it to occur. They are not rivals; they are complementary lenses. A mature reliability programme often uses FMEA to find the high-risk events and then FTA to dissect the worst of them.
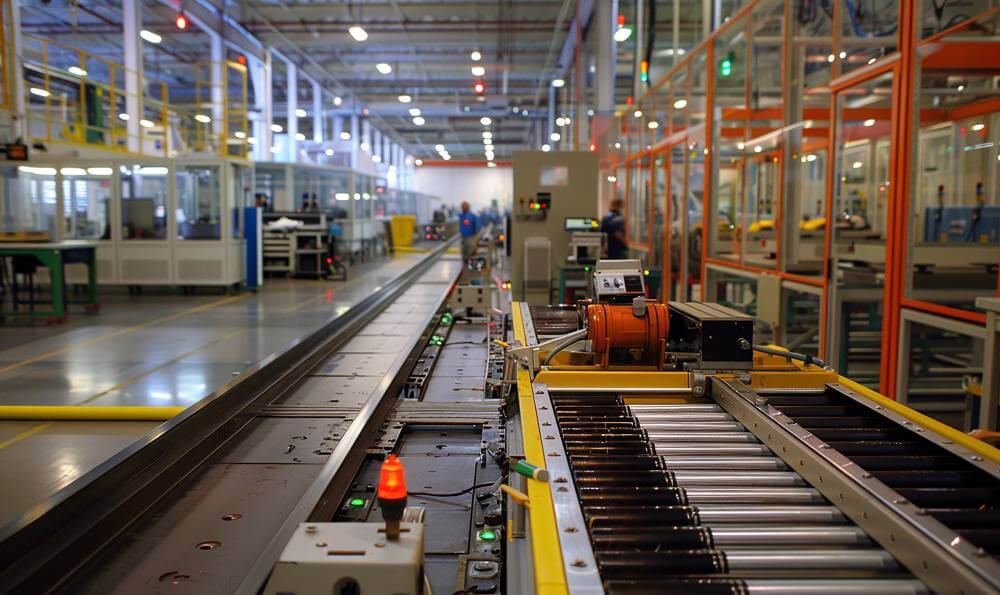
A bottling line suffers recurring unplanned stops. Start with FMEA: the team reviews every machine, lists failure modes — worn bearing, jammed star-wheel, failed sensor, slipping clutch — scores each on severity, occurrence, and detection, and finds that one motor's bearing failure carries by far the highest risk priority number. Now switch to FTA on that single event. Take motor stops as the top event and branch downward: loss of lubrication OR overload OR misalignment, each decomposing further into causes like a blocked oil line AND a missed inspection. FMEA told the team where to dig; FTA told them exactly how the failure assembles, so the fix targets the real root, not a symptom.
Use FMEA early and broadly — during design, process planning, or a reliability baseline — when you need to survey everything that could fail and rank it consistently. Use FTA when you have a specific, high-consequence event you must understand deeply, especially where multiple faults can combine or where safety and compliance demand a rigorous causal model. In maintenance terms, FMEA helps shape the overall strategy and where to place preventive or condition-based effort; FTA helps you solve a stubborn, critical failure that keeps recurring. The pairing — survey wide, then dive deep — is more powerful than either alone.
Both methods ultimately target unplanned downtime, the largest availability loss in OEE for most plants. FMEA helps you place maintenance effort where the risk is highest, converting potential breakdowns into planned work; FTA helps you eliminate the specific recurring failures that keep stealing availability. The link runs through reliability: every failure mode you design out or detect early raises MTBF and shrinks the six big losses. Reliability analysis is not a paperwork exercise disconnected from the floor — it is one of the upstream levers on OEE.
FMEA and FTA are only as good as the failure data behind them. Fabrico captures real downtime and failure events with reason codes and ties them to specific assets, so your occurrence scores and fault trees are grounded in what actually happens rather than memory or guesswork. It shows which failure modes recur and what they cost in lost OEE, feeding the next revision of your analysis and confirming whether a fix actually moved the number. Book a demo to ground your reliability work in live data.
FMEA is a bottom-up method that lists each component's failure modes and traces their effects, ranking risks. Fault tree analysis is top-down, starting from one undesired event and mapping the combinations of causes that could produce it. FMEA is broad and inductive; FTA is deep and deductive.
Use FMEA when you need a broad survey of everything that could fail and a consistent way to rank risks, such as during design or a reliability baseline. Use FTA when you must deeply understand one critical event, especially where multiple faults can combine.
Yes, and they complement each other well. A common approach is to use FMEA to identify the highest-risk failures across a system, then apply fault tree analysis to dissect the most critical of those events in depth.
RPN, or risk priority number, is typically the product of severity, occurrence, and detection scores for a failure mode. It gives a consistent way to rank which failure modes to address first, though it should drive action, not just documentation.
Both target unplanned downtime, the biggest availability loss in OEE. FMEA directs maintenance effort to the highest risks and FTA eliminates specific recurring failures, raising reliability (MTBF) and shrinking the six big losses.